
Radar and satellite ‘snowfall rate’ observations
March 2nd, 2019 by Jorel TorresForecasting snowfall and snowfall rates can be quite challenging, especially in radar-limited and or radar-deprived regions. A polar-orbiting satellite ‘Snowfall Rate’ product can be used together with radar observations to help anticipate snowfall rates, identify snowfall areal extent and snowfall maximas. To highlight the product’s capabilities, refer to the following snowfall case event over Northern Colorado, between 3-15Z, 2 March 2019 comprising of surface, radar and satellite observations.
Surface Observations over Northern Colorado from 3-15Z, 2 March 2019.
The 13-hr loop shows a decrease in air temperatures across Northern Colorado, exhibiting below-freezing temperatures. Over time, notice a surface low develop, just north of Denver, CO as southeasterly, upslope flow moved into the area. Additionally, the surface low in complement with an upper-level jet maxima (not pictured) and an increase in low-to-mid level moisture, produced enhanced snowfall totals over Northern Colorado.
Radar observations over Northern Colorado from 3-15Z, 2 March 2019.
Base Reflectivity radar observations (via Denver radar from the COD website) during the same time period, shows the evolution of higher reflectivity values (between 15-35 dBZ) observed over Northern Colorado. Notably from 11-13Z, a bright ‘snow band’ (an elongated reflectivity maxima) was observed, indicating heavy precipitation, or in this case, heavy snowfall over Larimer and Weld counties. But what snowfall rates are being observed? This is where the Snowfall Rate (SFR) product can be utilized.
Collocated Snowfall Rate (SFR) product and Radar Observations at ~11Z, 2 March 2019.
The SFR product is derived from passive microwave observations via polar-orbiting satellites, where SFR observations are displayed in units of liquid equivalent ‘inches per hour’. The image below is a direct comparison of SFR in relation to the radar (albeit, offset by two minutes) at ~11Z, 2 March 2019. Notice the line of higher liquid equivalent snowfall rates (0.04-0.1 inches per hour) correspond well with the bright ‘snow band’ seen in the radar. Additionally, the SFR product has the ability to observe the snowfall rate areal extent, seen throughout Wyoming, Nebraska and South Dakota via 1 satellite swath (i.e. DMSP). In contrast, the Denver radar exhibits a limited range, where an adjacent radar needs to be utilized to see snowfall occurring in nearby domains (i.e. users would need to refer to the Cheyenne, WY or North Platte, NE radars).

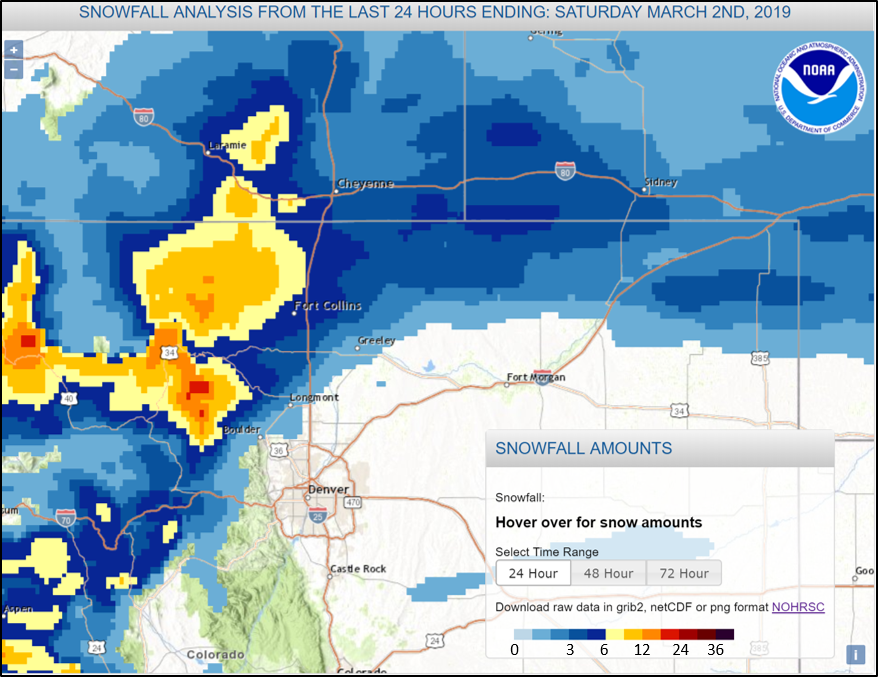
Snowfall Analysis and snow totals (ending ~9AM MST, 2 March 2019).
Via NWS/NOAA snowfall analyses, note the snow totals from this event, ranging from 0-6 inches at low elevations, and 6-plus inches at higher elevations.
For interested readers, NASA-SPoRT has an additional product, denoted as the Merged SFR product (i.e. incorporates radar and SFR together) that can be accessed online via the following link.
Posted in: POES, Satellites, Winter Weather, | Comments closed
Low cloud / fog over snow covered ground on 25 February 2019
February 25th, 2019 by Dan BikosDuring the overnight hours of 25 February 2019, low clouds and fog developed over portions of northwest Kansas, eastern Colorado and southwest Nebraska. The low cloud and fog developed over a field of snow on the ground from a recent blizzard. Low cloud and fog on top of snow on the ground can be difficult to detect in some satellite imagery, while in other satellite imagery it is easy to detect, for example see this 4 panel GOES-16 imagery:
The loop spans the nighttime to daytime hours.
Upper left is the GeoColor product.
Upper right is the Day Cloud Phase Distinction product.
Lower left is the nighttime microphysics product.
Lower right is the 10.3 micron (IR) band.
During daytime hours, note how difficult it is to discriminate between low cloud / fog versus snow on the ground in the GeoColor product, both features appear white. However, during the daytime we can make the discrimination between low cloud / fog versus snow on the ground in the day cloud phase distinction RGB. Snow on the ground appears green, why? There is little contribution from Red (10.3), large contribution from Green (highly reflective at 0.64 microns) and small contribution from Blue (absorptive at 1.6 microns). The low cloud and fog appears cyan since the contribution from Blue is larger (liquid water clouds reflect much more than snow on the ground at 1.6 microns).
The low cloud and fog during the nighttime hours is observed as bright green in the nighttime microphysics product and light blue in the GeoColor product. It may be seen in the 10.3 micron band as well, but is much more difficult to detect due to the lack of contrast relative to the other 2 RGB products. High clouds are also observed moving over the low cloud / fog region in northwest Kansas, these are observed as black or dark red colors in the nighttime microphysics product. The high clouds acted to seed ice crystals into the low level clouds underneath, leading to snow flurries across the area.
Another product that shows all of this quite well is the CIRA Snow/Cloud-Layers product:

This loop spans daytime hours only since the discrimination between clouds versus snow on the ground can only be made during the daytime in this product. Snow appears white in color, which may be more intuitive compared to other RGB products. Bare ground is dark green, low clouds or fog are yellowish-green and high level clouds are pink.
Posted in: Ceilings, Fog, Visibility, | Comments closed
Popocatépetl Volcanic Eruption
February 15th, 2019 by Jorel TorresPopocatépetl Volcano erupted overnight, spewing volcanic ash emissions, from 0200-1600UTC, 15 February 2019. Geostationary and polar-orbiting satellites observed this atmospheric phenomenon from 00-16 UTC, 15 February 2019.
GOES-16 3.9um
A hot spot (i.e. white, warm brightness temperature) is produced from the volcanic eruption, along with its ash plume (i.e. elongated, cooler, black, brightness temperatures). Notice how the ash plume advects to the southwest, due to moderate, surface-to-mid-level northeasterly winds.
GOES16 – Split Window Difference (SWD)
In the animation, SWD observes low-level atmospheric water vapor (i.e. moisture) and is derived from the 10.3um-12.3um channel difference. Once the volcano erupts, notice the elongated volcanic ash plume (i.e. seen in purple), that comprises of ash and cloud liquid droplets. In the animation, note how the plume is conspicuous compared to the 3.9um observations.
GOES-16 – Volcanic Ash Microphysics (EUMETSAT)
The EUMETSAT RGB shows the volcanic ash plume in red, where different shades of red, indicate varying levels of volcanic ash concentrations. Also, volcanic eruptions can produce varying levels of sulfur dioxide (SO2), which is bad for human health. In this animation, there was no SO2 detected; no yellow (i.e. indicates mixed ash and SO2), or shades of green colors (i.e. purely SO2) were observed near the volcanic eruption.
SNPP – Near-Constant Contrast (NCC) (Nighttime visible imagery)
SNPP, a polar-orbiter, also captured the volcanic ash plume, utilizing NCC nighttime visible imagery. NCC, a derived product of the Day/Night Band (DNB), utilizes a sun/moon reflectance model that illuminates atmospheric features, and senses emitted and reflected light sources during the nighttime. In the static SNPP NCC image below, notice the emitted light sources produced from cities and towns (i.e. Mexico City and Acapulco) and the reflected light sources (i.e. clouds and in this case, the volcanic ash plume).

Posted in: Aviation Weather, GOES R, POES, Satellites, Volcano Weather, | Comments closed
14 February 2019 California Atmospheric River event
February 15th, 2019 by Dan Bikos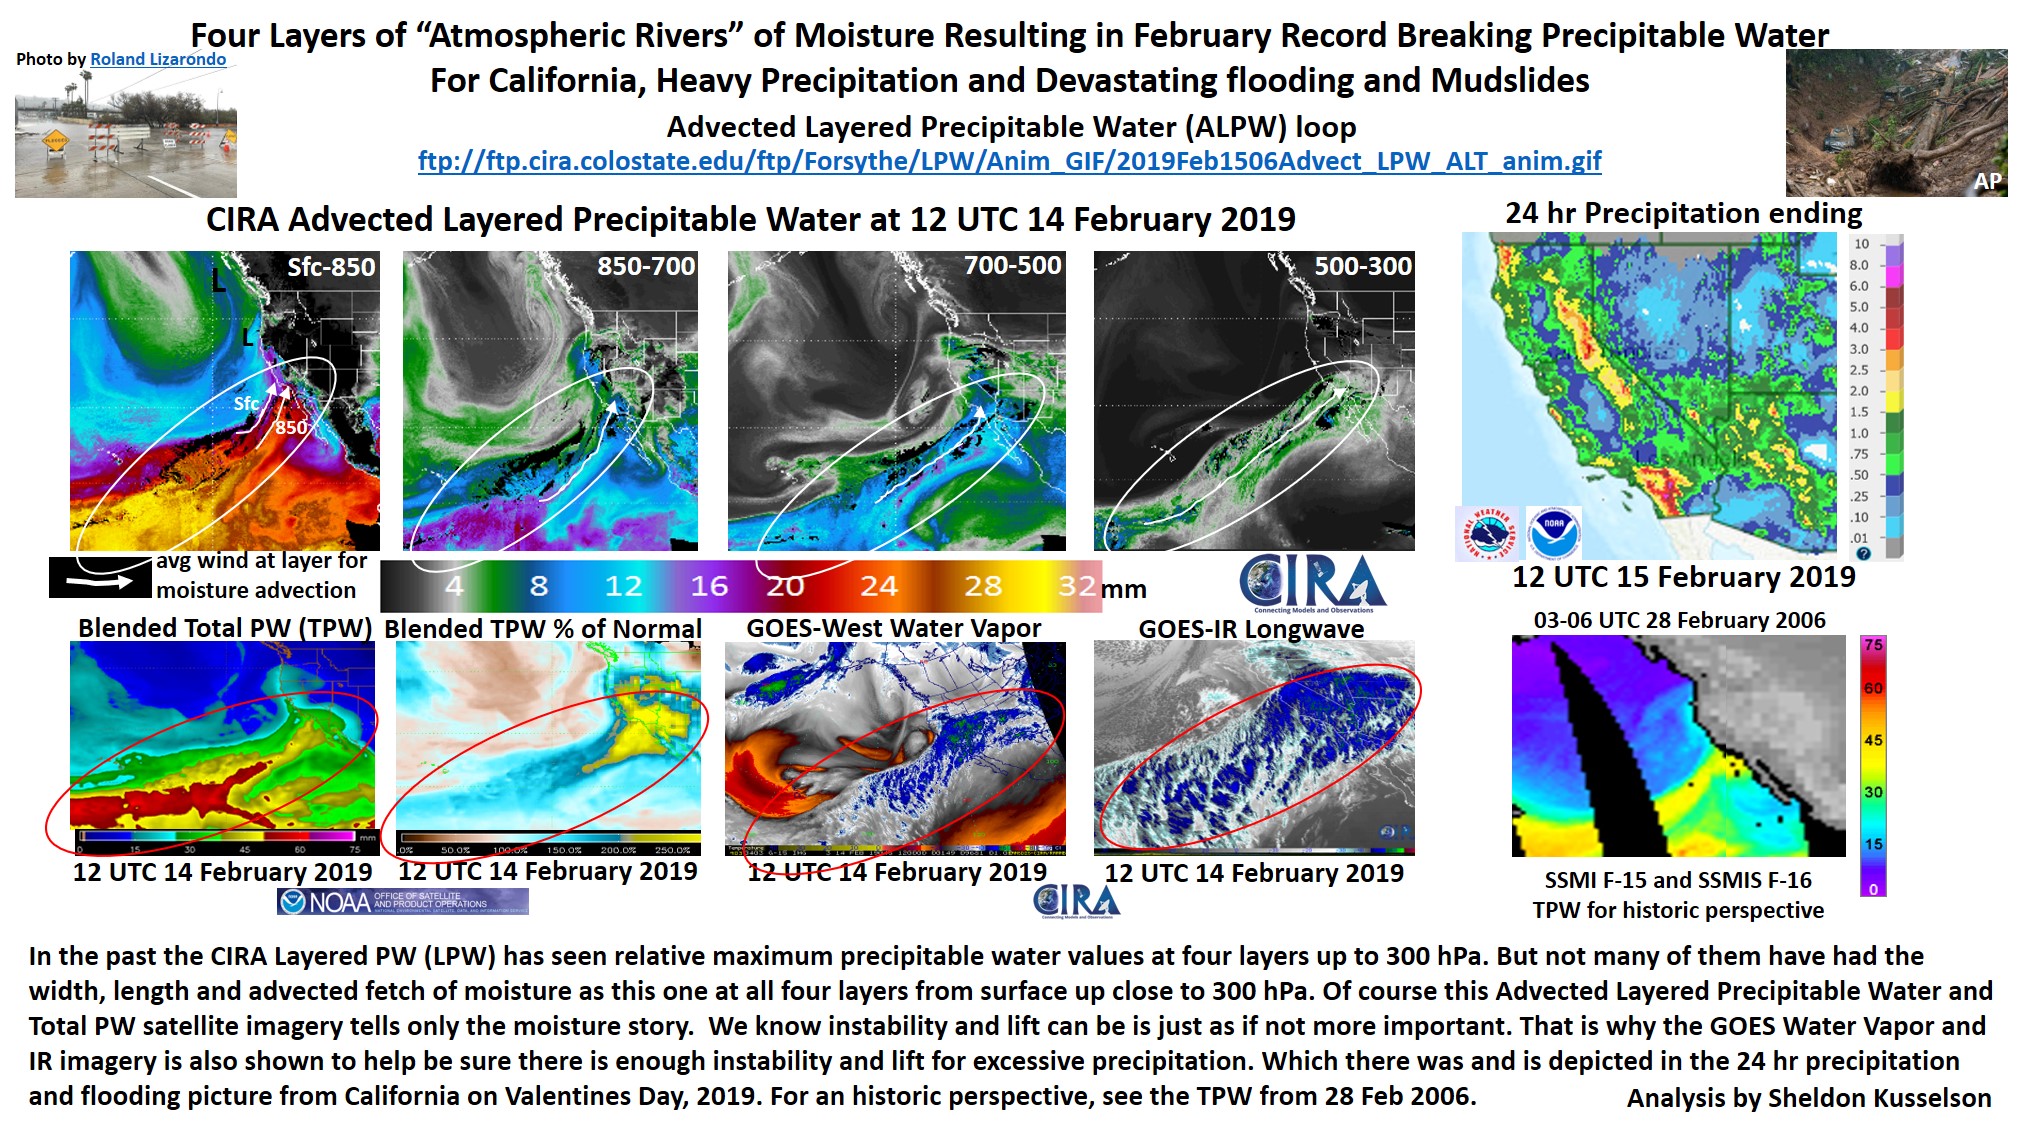
Advected Layer Precipitable Water loop:
Blended Total Precipitable Water loop:
Percent of Normal TPW loop:
Posted in: Heavy Rain and Flooding Issues, Hydrology, Satellites, | Comments closed
VIIRS Captures Ice/Ocean Movements
February 13th, 2019 by Jorel TorresBy Lewis Grasso and Jorel Torres
VIIRS captures interesting imagery in the Arctic. From 0314 UTC to 1233 UTC, 13 February 2019, VIIRS, on-board NOAA-20 and S-NPP, imaged fascinating features in the Arctic. In particular, imagery from Band I4 (3.74um) with a sub-satellite footprint size of 375-meters captured several features: 1) oscillation of an ice field due to lunar tides, 2) the boundary where the ice sheet is melting due to the interaction of relatively warm waters associated with the Gulf Stream, and 3) the melt water and associated currents in the ice-free ocean. Animation below, shows a loop beginning at 0314 UTC and extending to 1233 UTC. Within the loop the dark-greenish color represents the very cold ice sheet, northeast of Greenland, which is located in the lower right corner of the loop. Incidentally, portions of Svalbard, Norway are located in the upper-left corner. The lightest grey color represents the relatively warm ice-free ocean. The rapidly moving cloud-field is evident over the ice free ocean by a black color. Interpretation is the following: periodic oscillations are associated with the lunar tide, note the back and forth motion of the ice sheet. As the boundary of the ice sheet melts, the cold melt water flows into the relatively warm ocean and appears relatively dark. The left most dark plume of melt water is reminiscent of a drop of black ink falling downward in a tank of clear water. We invite the reader to think, when was the last time you have seen this type of view in the Arctic? Kudos to the JPSS Program.
Posted in: Miscellaneous, POES, Satellites, | Comments closed