Alberto
May 29th, 2018 by Jorel TorresAs of 29 May 2018, subtropical depression Alberto has been advecting northward, through the southeastern United States. Alberto made landfall yesterday 28 May 2018, along the Gulf Coast, near the Florida Panhandle. Alberto produced heavy rainfall and has the potential for tornadoes, as it pushes north into the Ohio Valley within the next few days. Rain estimates are 3+ inches in several southeastern states.
Below are two static satellite images of Alberto. The first one is the Near-Constant Contrast (NCC), a derived product of the Day/Night Band (DNB). NCC utilizes a sun/moon reflectance model that illuminates atmospheric features, and senses emitted (i.e. city lights) and reflected light sources (i.e. clouds) during the nighttime. NCC imagery is taken at 0735Z, 29 May 2018, during the full-moon stage of the lunar cycle. Notice the large areal extent of Alberto, engulfing a few southeastern states. Spatial resolution is at 750-meters.

The second image is of the GOES-16 infrared, low-level water vapor imagery (channel 10, 7.3um) at 0737Z, 29 May 2018. Imagery shows the convective, cold cloud tops (cold brightness temperatures, indicated in blue and green colors) of Alberto that can produce heavy precipitation and severe weather. Spatial resolution is at 2-kilometers.

More updates on Alberto can be seen by the following link.
Posted in: Tropical Cyclones, | Comments closed
Buzzard Fire, New Mexico
May 24th, 2018 by Jorel TorresA fire has initiated in western New Mexico, denoted as the Buzzard Fire. Currently, the fire is burning within the Gila National Forest in Catron County, New Mexico. As of this morning, 24 May 2018, the fire has burned 4,500 plus acres. The cause of the fire is unknown and is under investigation. New Mexico has been experiencing very dry conditions and exhibits D1 to D4 (moderate to exceptional) drought conditions throughout the state. Refer to latest US Drought Monitor image of New Mexico below.

The Buzzard Fire has also been detected in the satellite imagery. In the GOES-16 3.9um infrared image (below), thermal anomalies (yellow to red colors) have been detected from the Buzzard Fire. Satellite image is taken at 0912Z, 24 May 2018 and is at a spatial resolution of 2 -kilometers.

Additionally, the fire has been seen via the Near-Constant Contrast (NCC) product, a derived product of the Day/Night Band (DNB), that illuminates atmospheric features, and senses emitted (i.e. lights from fires) and reflected light sources (i.e. clouds) during the nighttime. Product image was taken at 0910Z, 24 May 2018, and shows the emitted light produced from the Buzzard Fire, located west of Interstate – 25. Product spatial resolution is 750-meters.

For latest updates on the Buzzard Fire, refer to the ‘Active Fire Mapping Program’ website.
Posted in: Miscellaneous, | Comments closed
Fog event of 22 May 2018 in the midwest – focus on nighttime microphysics RGB
May 23rd, 2018 by Dan BikosDuring the overnight and morning hours of May 22, 2018 there was widespread fog over the upper midwest region centered around Wisconsin. We’ll start by looking at the familiar fog product (10.3 – 3.9 micron) overlaid with ceiling (top left: hundreds of feet AGL) and visibility (bottom in miles):
Recall in the fog product, high clouds composed of ice are negative, while low cloud OR fog is positive with increasing confidence in magnitude (darker blue). Note the positive values cover a rather large area, however it’s not uniform and there appear to be other cloud layers also present. Note the higher cirrus (indicated in black colors) moving in from Nebraska into southwest Iowa (likely associated with prior convection). Also note the regions of gray in central and northern Wisconsin, these can be interpreted as clouds that are less likely to be low clouds or fog, however keep in mind this cloud layer may be obscuring low clouds or fog underneath therefore there is a need to check surface observations.
In the GOES-R series, we now have additional RGB products that can provide more detailed and potentially additional information compared to the fog product. For example, the nighttime microphysics RGB:
If you’re unfamiliar with this product, information can be found on the quick guide:
http://rammb.cira.colostate.edu/training/visit/quick_guides/QuickGuide_GOESR_NtMicroRGB_final.pdf
What additional information can be observed in the nighttime microphysics RGB that we were unable to observe in the fog product? There are additional colors over regions that were displayed as various shades in blue (fog or low cloud) in the fog product, also, there are additional colors in regions that were depicted as gray in the fog product. One of the primary advantages to the nighttime microphysics RGB is that it discriminates between low cloud and fog as observed by GOES.
Let’s first focus on eastern South Dakota to extreme southwest Minnesota into northwest Iowa. The fog product showed positive brightness temperature difference values which would correspond to low cloud or fog. The nighttime microphysics product over the same region is dull (darker) aqua. Our assessment of dull aqua is based on a comparison to other aqua colored regions, for example, look further east in Minnesota where the aqua color is brighter which is more likely to be low cloud. This agrees with surface observations which indicate 1/4 mile visibility during the period when the dull aqua increases.
Now let’s focus on central Wisconsin. In the fog product, this was a mix of blue and gray colors, the gray represents less confidence in low cloud / fog while the blue is more confidence in low cloud / fog. In the nighttime microphysics RGB we see a mixture of shades of green, along with some purple and localized red. This provides information on the different cloud top heights. Observations indicated occasional light rain in these regions, corresponding to what you may expect with thicker clouds.
Next, let’s focus in on the region indicated by the red box below:
During the loop, note a small region of green passes through the observation site in the red box, after passage we observe a dull aqua color. The various shades of green correspond to low to mid level clouds composed of water droplets. After the passage of this cloud we observe dull aqua (fog) and the observation indicates that fog has formed. Presumably after the cloud goes by, radiation fog formed in this case.
Finally, we will conclude with a challenging scene for interpretation in northern Illinois, southern Wisconsin and the eastern half of Iowa. The most obvious feature is a region of high clouds as indicated by near black or dark blue colors in the RGB product advecting eastward. It’s important to note that fog may exist but simply be obscured by high clouds above it and indeed we observe this over our region of interest. Now let’s focus in on north central Illinois near the Wisconsin border where interpretation is particularly challenging, there is a variety of colors that are changing and advecting through during the loop. At the start of the loop, observations indicate widespread fog with low visibility, however the dull aqua may not appear as widespread as you may expect relative to the observations. There is quite a bit of aqua and light green at this time. This would indicate low clouds are present so that the fog is being obscured by a cloud deck over the fog. A bit later in the loop, after the passage of the small patch of high clouds, we observe more regions of dull aqua (fog) before later becoming obscured by more widespread high clouds. Note that during the loop, the observations do not change appreciably in northern Illinois / southern Wisconsin meaning that most of this area remains in fog despite the changes we see in the nighttime microphysics RGB.
In summary, we analyzed a challenging scene where fog was widespread but so were different types of clouds. The nighttime microphysics RGB showed its utility in identifying some areas of fog but it also showed us that fog can be obscured by cloud layers above it. When this is the case, using both surface observations and satellite imagery in tandem is critical to understanding the event. In other words, where we see the dull aqua in the nighttime microphysics RGB our confidence in fog should be high, but the absence of this color does not necessarily mean fog is not present.
Posted in: Aviation Weather, Ceilings, Fog, Visibility, | Comments closed
Hail swath observed by GOES-16
May 14th, 2018 by Dan BikosOn 14 May 2018, a severe thunderstorm near Denver, Colorado resulted in accumulations of hail (reports of 2 to 6 inches in depth locally).
The hail swath left by the thunderstorm can easily be observed in GOES-16 imagery:
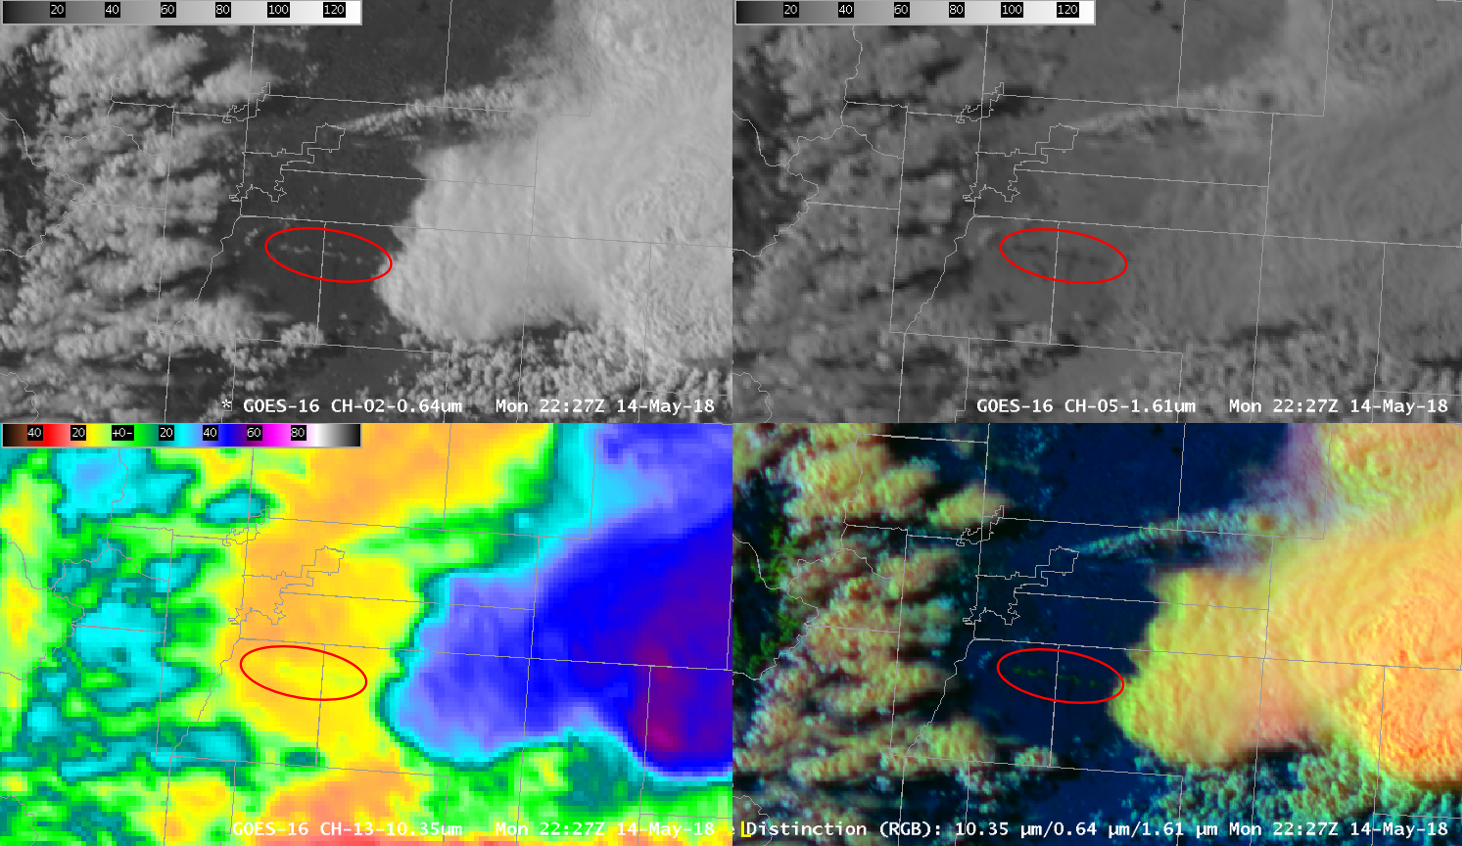
After the passage of the thunderstorms. The hail swatch can be seen as a line, see annotated image below for the hail swath:
The ground is white where hail accumulations occurred, much like snow cover. This is quite reflective in the visible (0.64 micron band) shown in the upper left, therefore it is white. At 1.6 microns (upper right), the hail absorbs radiation readily, therefore it is dark at this wavelength (black). In the lower left is the 10.3 micron band, the hail swath is colder than the surrounding ground, therefore it will have lower brightness temperatures than the surrounding ground. In this color table, yellow is colder than orange. Finally, the Day Cloud Phase Distinction RGB in the lower right. The Red component is the 10.3 micron band, the Green component is the 0.64 micron band and the Blue component is the 1.6 micron band. The hail swath shows up as green. Why? There is a strong contribution from the visible band (green) since the hail swath is highly reflective. There is little contribution from 1.6 microns since the ice absorbs efficiently (dark) and also from 10.3 microns since it is only slightly colder than the surrounding ground. Snow cover typically displays as green in this RGB for these reasons, in fact snow cover can be observed over the western portions of this scene along the mountains.
Posted in: GOES R, Hail, Satellites, Severe Weather, | Comments closed
Colorado Dust Storm
April 18th, 2018 by Jorel TorresYesterday, 17 April 2018, there was a large dust storm that occurred in the state of Colorado. The dust storm initiated due to dry and and very windy conditions, originating from the Great Sand Dunes National Park and Preserve, near Alamosa, Colorado. Throughout the afternoon, visibility was quite low, in portions of the state.
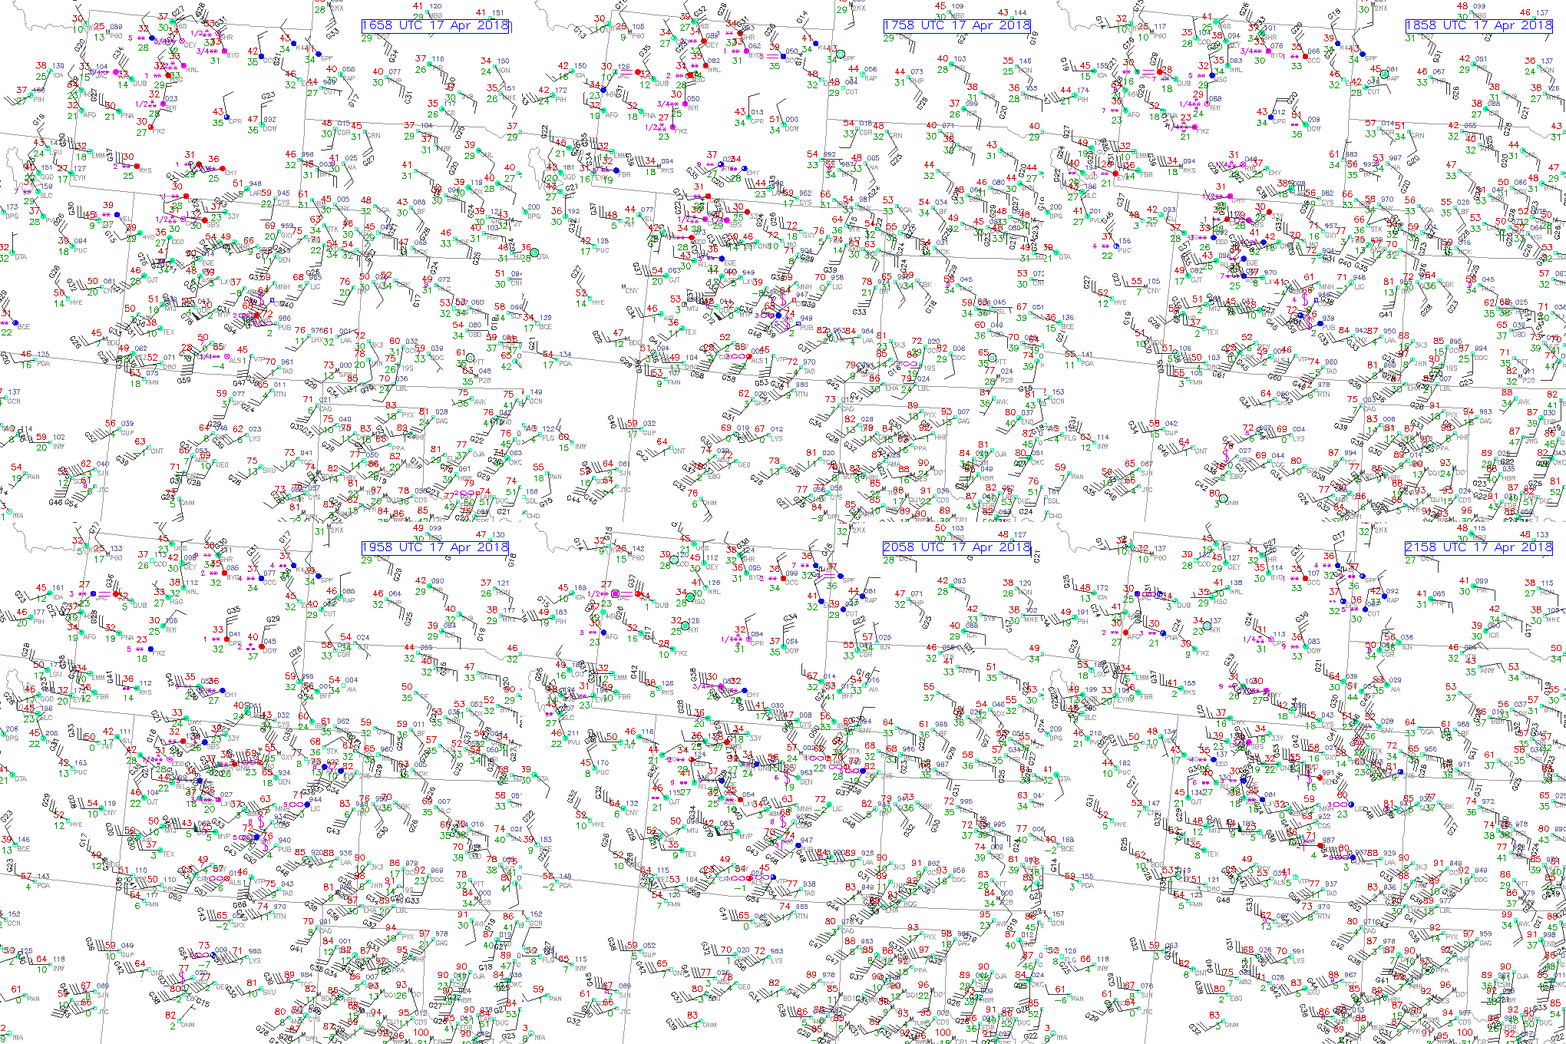
Check out the surface observations (via RAP Real-Time Weather), between 16-22Z, 17 April 2018. Over time, notice the dollar sign and infinity weather symbols, depicting dust and haze in central and eastern Colorado.

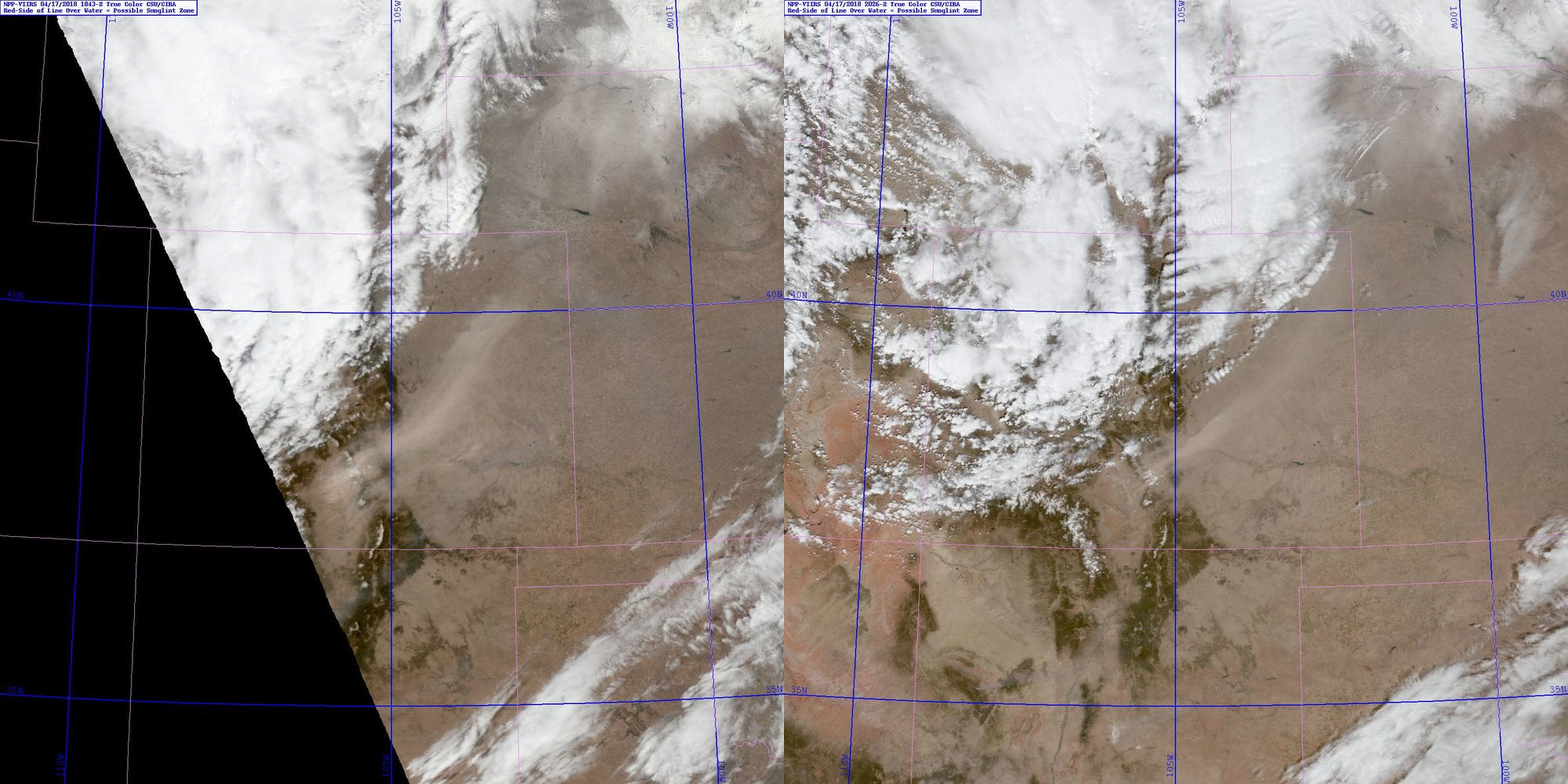
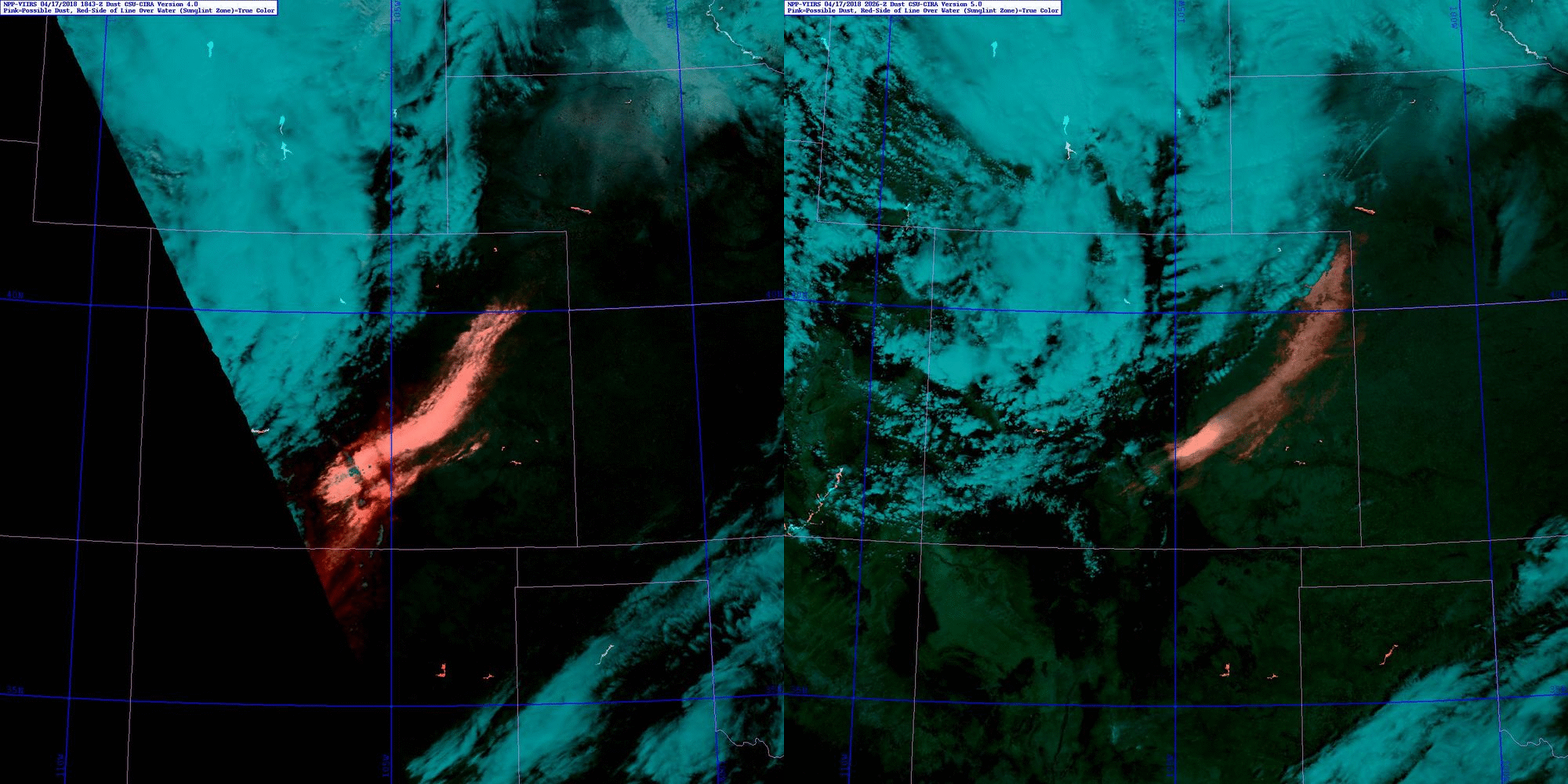
The dust storm was also seen via satellite by the Suomi-National Polar-orbiting Partnership (S-NPP) at 1843Z and 2026Z, 17 April 2018. Below are two satellite products observing the atmospheric phenomena.
VIIRS True Color Product (via RAMSDIS Online) from S-NPP.
Notice the ‘light, milky brown’ feature, emanate from south-central Colorado, where the Great American Sand Dunes reside. The feature elongates all the way to the Colorado/Kansas border, at the time of the overpasses.

VIIRS Blue Light Dust Enhancement Product (via RAMSDIS Online) from S-NPP.
See the bright pink feature, implying the areal extent of dust, advected eastward, seen from the two S-NPP overpasses.

For interested viewers, refer to the following social media link to check out a video of the dust event.
Posted in: Miscellaneous, | Comments closed


