
The Northern Lights Observed in the Lower-48
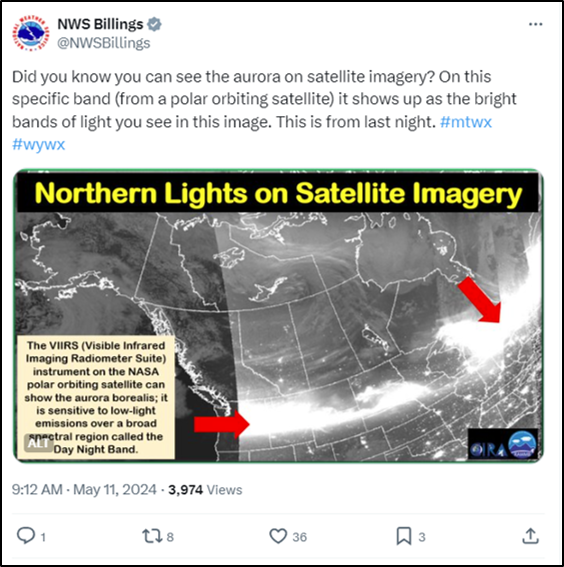
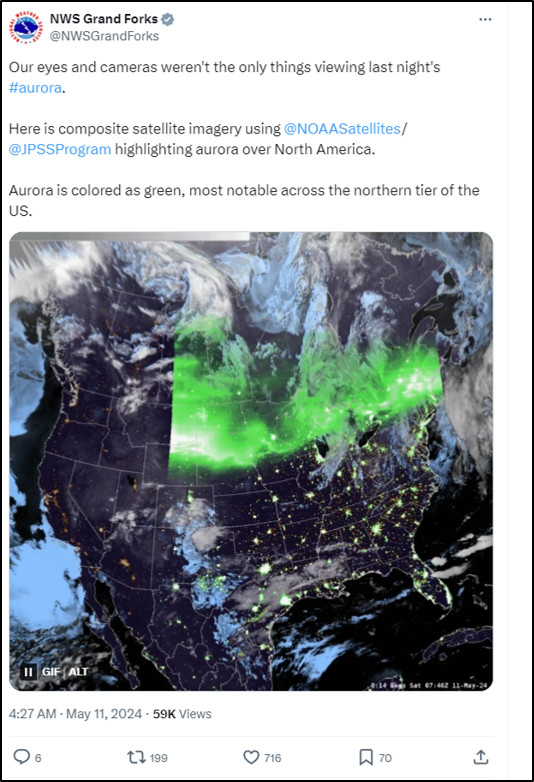
May 14th, 2024 by Jorel TorresA powerful geomagnetic storm transpired over the Lower-48 during the weekend of 11-13 May 2024. The sun produced coronal mass injections that impacted the Earth, creating auroras (a.k.a., northern lights) that were seen across the globe. Within CONUS, the auroras were visible as far south as Florida, Texas, and Alabama: locations where the northern lights are typically not observed. Spectacular photos of the event can be seen here.
Accessing the CIRA SLIDER – JPSS Northern Hemisphere Sector, one can observe the northern lights that dominated the northern tier of the U.S. from 6-12Z, 11 May 2024. The VIIRS Near-Constant Contrast (NCC), a derived product of the Day/Night Band (DNB) captures the extensive, emitted white streaks that are produced from the auroras. Clusters of emitted city lights can also be seen across CONUS.
National Weather Service (NWS) Weather Forecast Offices (WFOs) employed social media to highlight the nighttime visible imagery as a way to observe the northern lights. Click on the images below to view the social media posts and animations.
Posted in: POES, Satellites, Space Weather, VIIRS, | Comments closed
CIRA’s Satellite Moisture Products for the 4 May 2024 Rainfall Event in San Francisco
May 7th, 2024 by Dan Bikos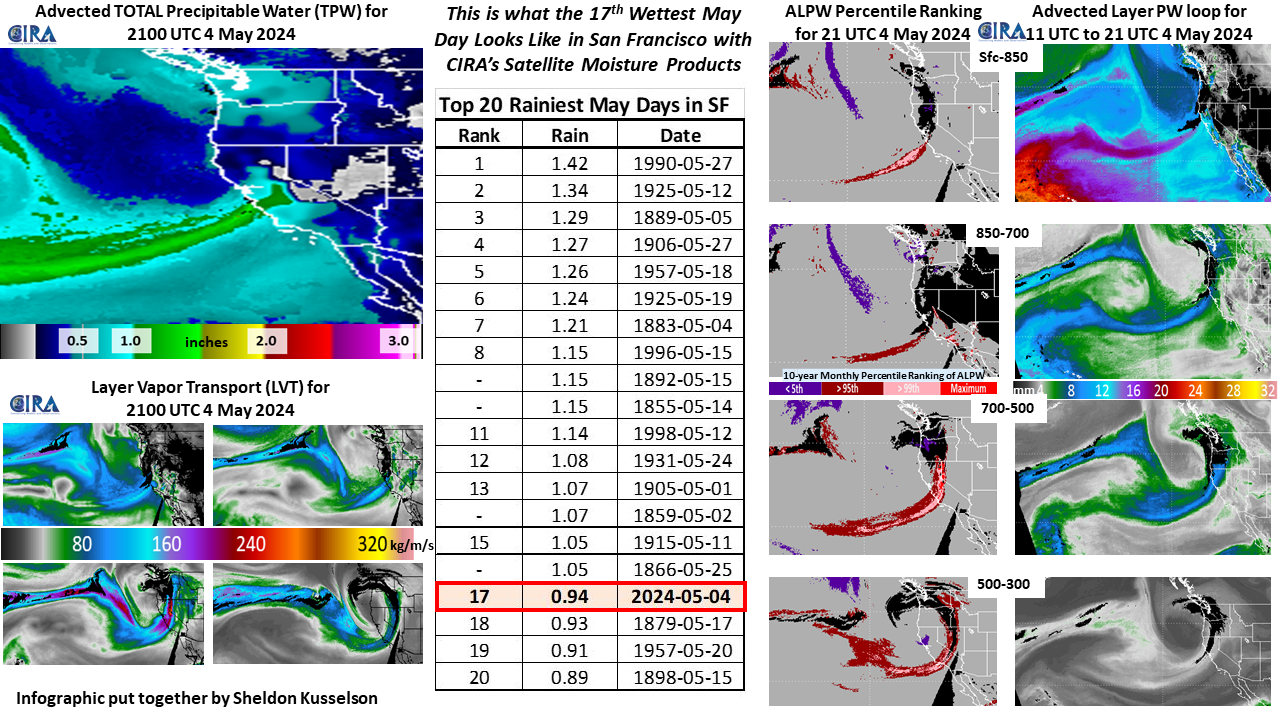
Posted in: Miscellaneous, | Comments closed
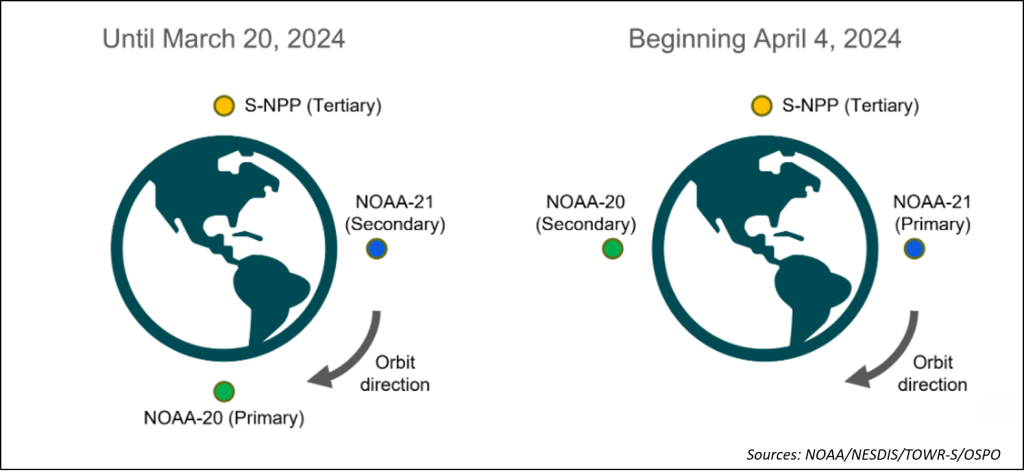
NOAA-21 Designated as the Primary Satellite of the JPSS Constellation
May 3rd, 2024 by Jorel TorresDuring March 2024, NOAA-21 was declared the primary satellite of the Joint Polar Satellite System (JPSS). In early April 2024, NOAA-20 (newly designated as the secondary satellite) completed its orbital shift placing NOAA-20 a half-orbit (~50 minutes) a part from NOAA-21. The tertiary satellite, SNPP, is now positioned a quarter-orbit between NOAA-21 and NOAA-20. A schematic below displays and compares the old JPSS orbital configuration (pre – 20 March 2024) to the finalized orbital configuration (4 April 2024).
For users, how does the new orbital configuration appear in the imagery? A CONUS perspective of VIIRS 11.45 µm swaths from NOAA-21, SNPP and NOAA-20 are seen on 10 April 2024. Notice the JPSS orbital sequence (observed from east coast to west coast) starts with NOAA-21, then ~25 minutes later SNPP, then NOAA-20 ~25 minutes after that. Afterwards, a 50 minute data gap occurs, then the sequence repeats.
The same orbital sequence can also be seen over Alaska. Refer to the 2 May 2024 VIIRS Snow/Cloud Layers animation that shows the sea ice coverage over the Bering and Chukchi Seas and low/high clouds and snow over the Last Frontier State.
Posted in: Miscellaneous, POES, Satellites, VIIRS, | Comments closed
Flooding in the UAE and Oman
April 26th, 2024 by Jorel TorresDuring mid-April 2024, unprecedented flooding occurred in the Middle East, specifically in the countries of the United Arab Emirates (UAE) and Oman. Over the course of a few days, a series of storms produced significant precipitation totals that pummeled the region, which led to extensive flooding that shut down schools, grounded or diverted flights, and caused fatalities.
The Meteosat-9 SEVIRI 6.25 µm captured numerous storms that passed through the region from 14-16 April 2024. The upper-level water vapor channel also observed a strengthening low-pressure system that enhanced precipitation in the UAE and Oman during 15-16 April 2024. In the water vapor animation below, notice that several storms develop on the southeast side of the upper-level trough.
With an emphasis on 16 April 2024, a SEVIRI Day Cloud Phase Distinction RGB animation can be seen, that captures storms that develop and spread across eastern Saudi Arabia, Qatar, the UAE and Oman. At ~12Z, a north-to-south line of convective initiation develops in the UAE/Saudi Arabia region, and advects eastward towards Oman. Outflow boundaries (seen in cyan) are also seen moving southward in eastern Saudi Arabia.
JPSS polar orbiting satellites observed the severe weather as well. Although, the polar-orbiters have a coarse temporal resolution (compared to the geostationary satellites), they provide high spatial resolution imagery at 375-m. NOAA-20 and NOAA-21 VIIRS Day Cloud Phase Distinction RGB imagery observed the storms at 0930Z and 1019Z, 16 April 2024.
During the same time period, the SEVIRI Dust RGB observed areas of blowing dust (i.e., in bright magenta/pink) in southern Saudi Arabia. Dust associated with the outflow boundaries can also be seen (pink/purple shades).
The Blended Total Precipitable Water (TPW) product provided insight of the moisture content within the region. Blended TPW observed high precipitable water values (2+ inches seen in red colors) in the southeastern part of the Arabian Peninsula. The rich moisture plumes aided in the development of heavy precipitation that led to flooding in the region. Note, Blended TPW observes the total precipitable water throughout a column in the atmosphere and does not identify where the moisture is located aloft (e.g., 850mb-700mb layer).
Using the NOAA Satellite Proving Ground Global Flood Products Archive, one can get a sense of the flooding that transpired in the UAE. A ‘Before’ (7 April 2024) and ‘After’ (17 April 2024) VIIRS Flood Map image comparison shows the extent of flooded pixels (yellow to red pixels) near and southwest of Abu Dhabi, UAE. Noticeable new areas of inundation from the heavy precipitation event can be seen inland, and along highways in the 17 April 2024 – VIIRS Flood Map image. The VIIRS Flood Map product has a 375-m spatial resolution.
Posted in: Convection, Dust, GOES, Heavy Rain and Flooding Issues, Hydrology, POES, Satellites, Severe Weather, VIIRS, | Comments closed
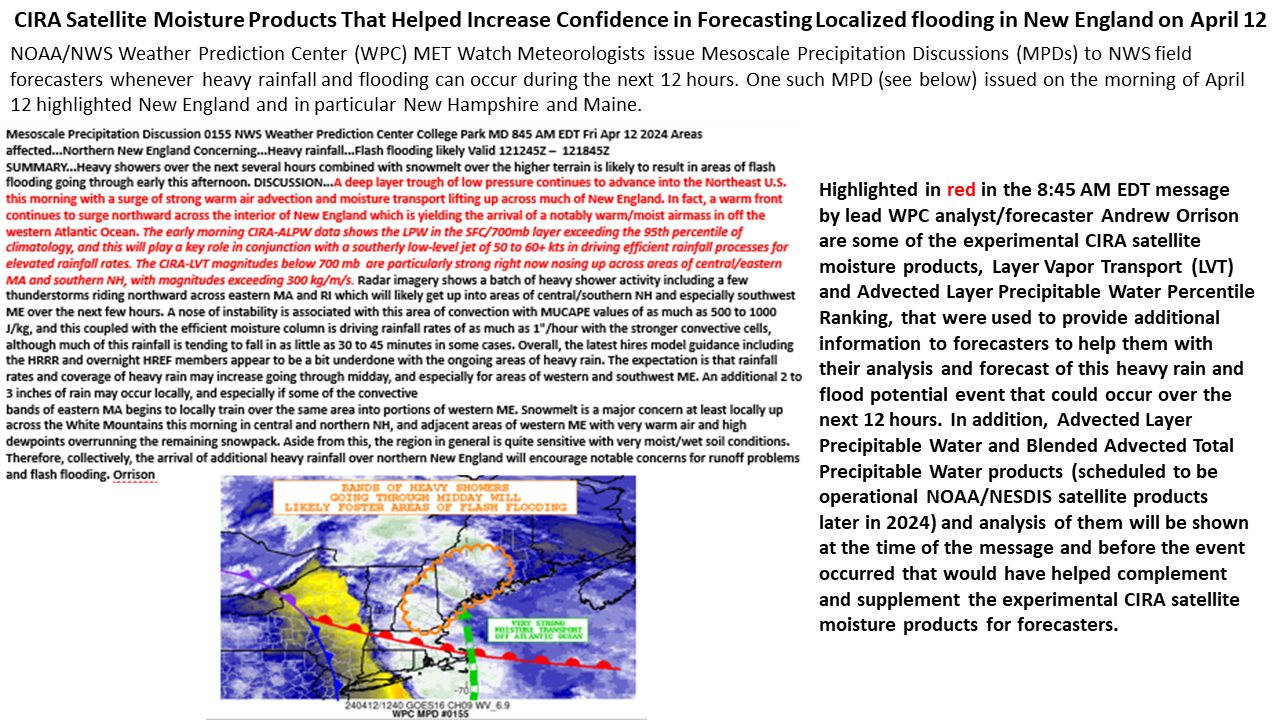
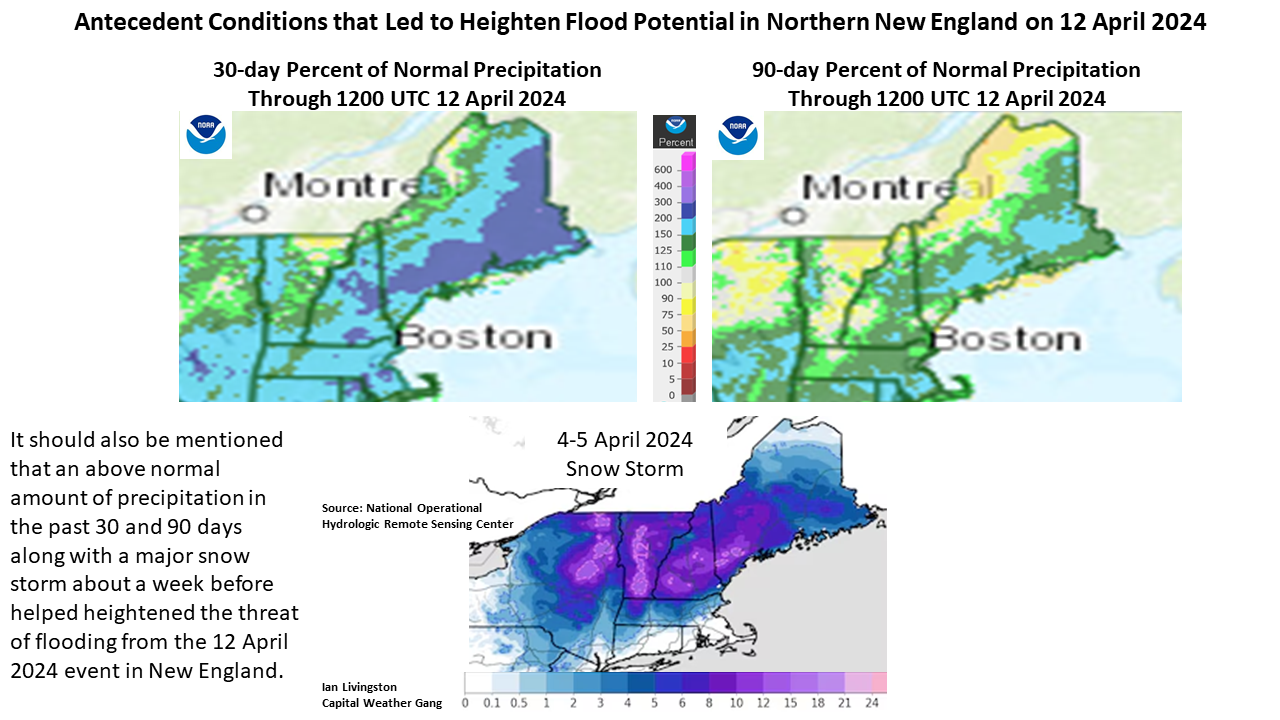
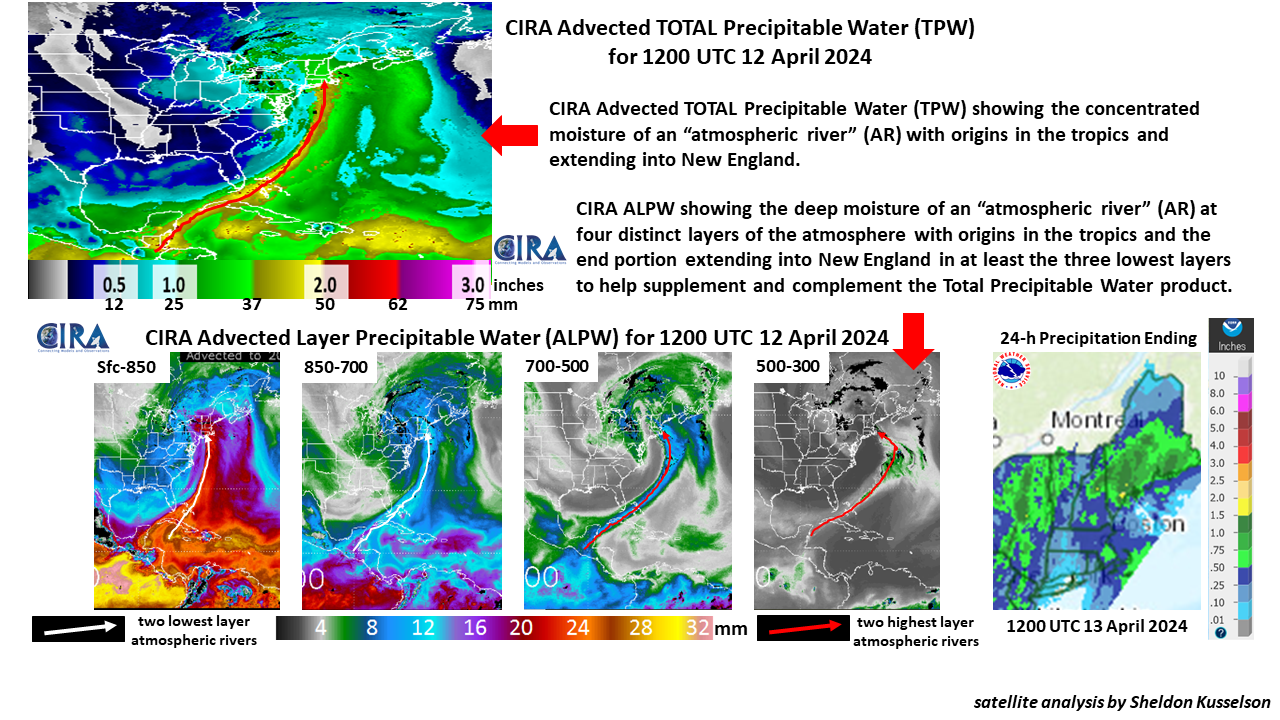
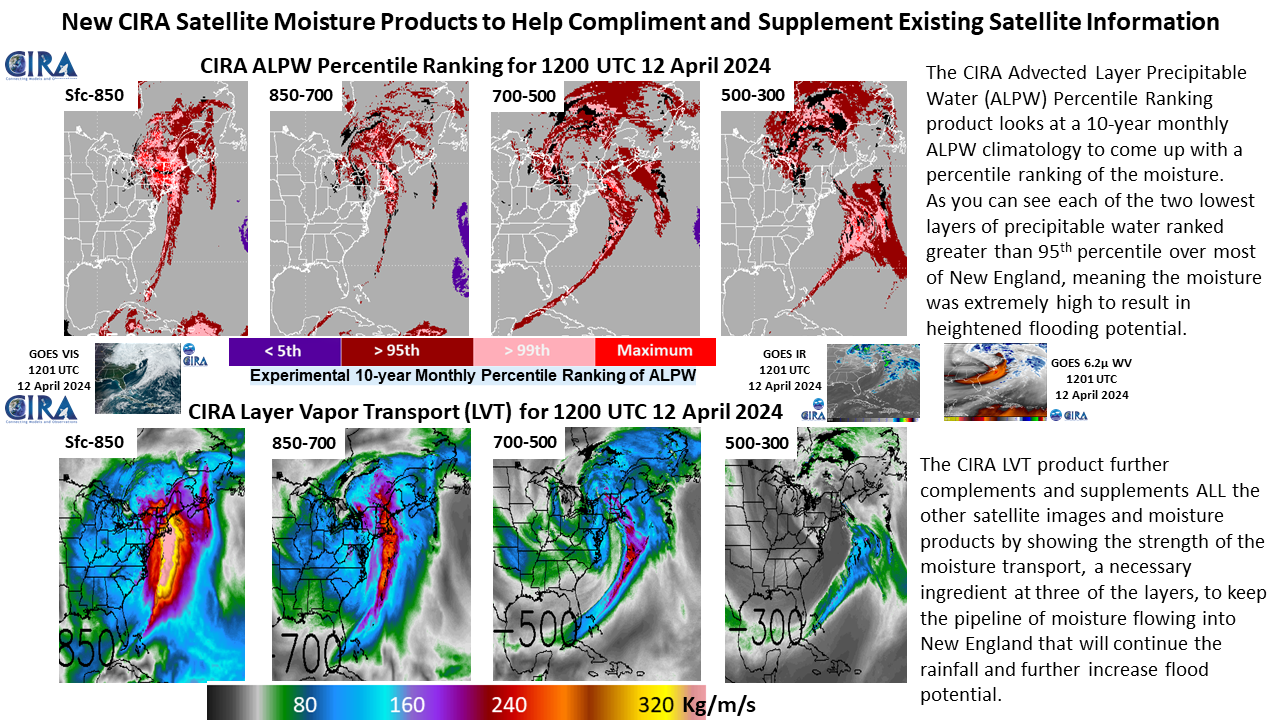
CIRA Satellite Moisture Products – New England localized flooding on April 11-12, 2024
April 17th, 2024 by Dan BikosBy Sheldon Kusselson
Animations:
Posted in: Heavy Rain and Flooding Issues, Hydrology, POES, Satellites, | Comments closed