
Tropical Cyclone Dumazile
March 5th, 2018 by Jorel TorresA tropical cyclone has been present in the Indian Ocean, the past few days. Yesterday, on 4 March 2018, tropical cyclone Dumazile skirted along the coasts of Madagascar and La Reunion bringing high winds, heavy rain and storm surge along the way. To persons that are not familiar, Madagascar is located on the southeast side of Africa, a remote island, embedded in the western Indian Ocean.
A Day/Night Band (DNB) image below shows the location of Dumazile, just east of Madagascar at 2137Z , 4 March 2018 (0037Z, 5 March 2018, local time). The nighttime satellite image, highlights the tight-circulation, the cloud convected tops and the large areal extent of Dumazile. Convected cloud tops are indicative of heavy precipitation. As of early this morning, 5 March 2018, Dumazile had maximum sustained winds of 120+ miles per hour (mph) and is forecasted to move south, southeast (i.e. away from Madagascar) at approximately 13 mph, according to the Joint Typhoon Warning Center (JTWC).

For more information on Dumazile, click on the following web-link.
Posted in: Tropical Cyclones, | Comments closed
East Coast Weather….
March 2nd, 2018 by Jorel TorresWinter Storm Riley inundated the northeast United States with strong winds, storm surge and high amounts of rain and snow. Current snowfall totals over the northeast can be seen via the National Weather Service – Snowfall Reports web-link. The screenshot below, shows the snowfall distribution over the northeastern United States, with current snowfall observations (as of 2230 UTC, 2 March 2018) ranging from just a few inches (blue colors) to over 20 (red, maroon colors) in some areas!

A Near-Constant Contrast (NCC) image (below) taken at 0645 UTC, 2 March 2018, shows the large, areal extent of Riley, as Riley produced damaging winds and power outages across the northeast. Corresponding cloud cover (reflected light sources) and city lights (emitted light sources) can be also be seen in the imagery.

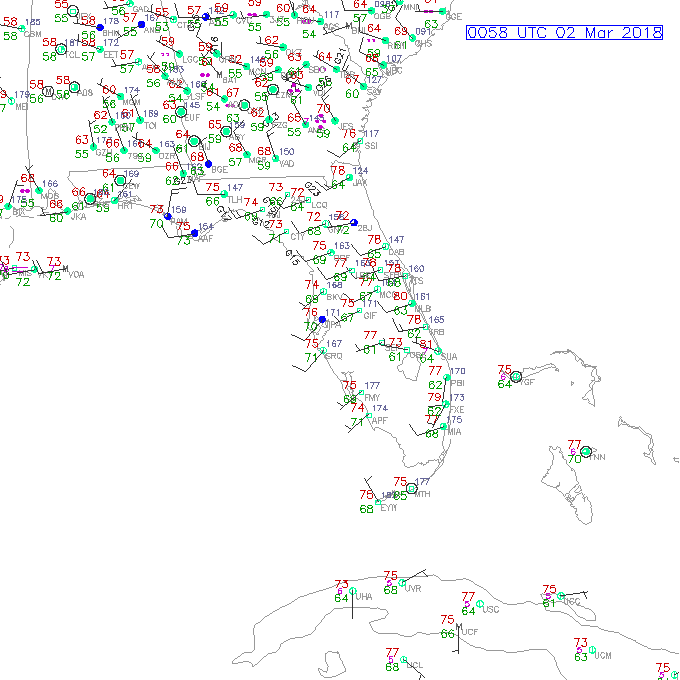
Another feature to highlight in the NCC imagery is the cold front across the state of Florida. Using the same image from above and zooming in to the state of Florida, notice the ambient cloud cover and elongated line of clouds, expressed horizontally. Although this is a static image at 0645 UTC, 2 March 2018, one can verify the elongated line of clouds is a cold front passing through the state, via surface observations.
Using surface observations at a similar time stamp (0658 UTC, 2 March 2018), there is a dramatic shift in winds, from north-northwesterly in northern Florida, to west-southwesterly winds in southern Florida (see red circle). The rapid change in wind direction is an indication of a front moving through the area, in this case, a cold front.

To see the cold front advect south, through the state of Florida, see the following animation. Notice the change in air temperatures (values in red), from low-to-mid 70’s to the upper 50’s, and lower 60’s. Animation is from 0058-1458 UTC, 2 March 2018. (Images courtesy of RAP Real Time Weather data)
Posted in: Miscellaneous, | Comments closed
Mississippi and Ohio River Flooding
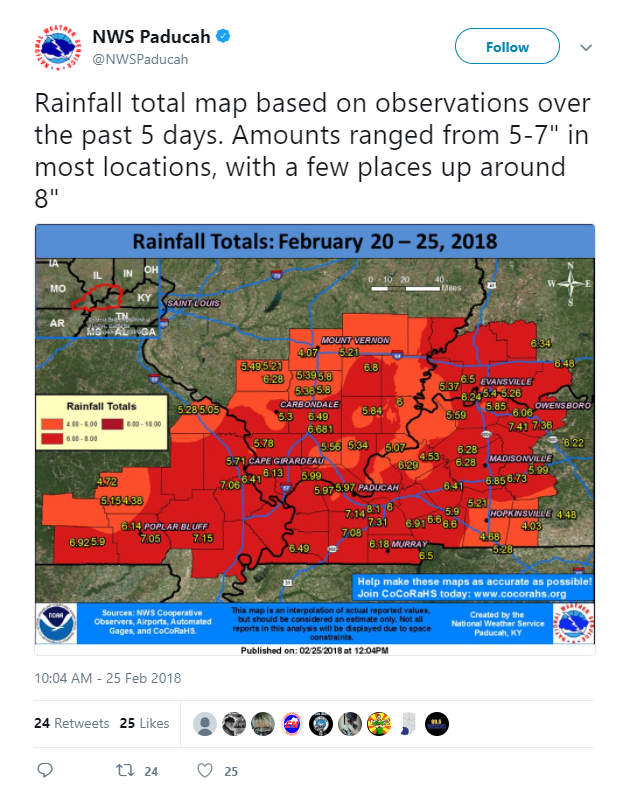
February 26th, 2018 by Jorel TorresMore flooding has occurred over the past weekend, due to a series of storms passing through the Lower Mississippi River Valley and along the Ohio River. Storm totals across the area were in the range of 4-8 inches of liquid precipitation. In the image below, National Weather Service (NWS) – Paducah, Kentucky shows total precipitation values along the Mississippi and Ohio Rivers, and displays the states of Missouri, Illinois, Tennessee, Indiana and Kentucky on 25 February 2018. For a zoomed-in image click on the following NWS-Paducah social media link.
In complement to these totals, one can also see the magnitude of the flooding via the VIIRS Flood Detection Map product, that can be seen via the RealEarth website. There are 2 subsequent images below. The first image shows a google map, in this case, covering where the Lower Mississippi River Valley and the Ohio River intersect, along with the neighboring states.

The second image shows the VIIRS Flood Detection Map product over the same domain. The product highlights the areas of inundation (yellow, orange and red colors) in relation to the open water (blue) and land (brown). In the southeast portion of the image (bottom-right corner) one can see ‘grey colors’ that are an indication of cloud cover in the area. The images were taken at 1932 UTC, 26 February 2018 and are at a spatial resolution of 375 meters. Notice, the inundation areas are along the rivers, but there are significant amounts of flooding just west of the Mississippi River, and north and south of the Ohio River. What makes matters worse, is more rain is expected within the next 3-5 days, most likely exacerbating the situation.

Posted in: Miscellaneous, | Comments closed
Flooding across the CONUS
February 23rd, 2018 by Jorel TorresWithin the last few days, extensive flooding has occurred due to heavy precipitation from Texas all the way to Michigan. Just look at the NOAA NWS River Forecast map, that encompasses river gauge data across the CONtinental United States (CONUS) on 23 February 2018. Each of the data points exhibit the magnitude of flooding. Notice the range of colors, depicting river gauges that are experiencing no flooding (green), near flood stage (yellow), minor flooding (orange), moderate flooding (red) and major flooding (purple).

If one zooms in a little bit closer at the state of Michigan, one can see the range of flooding across the state.

In complement to river gauge data, one could also see the magnitude of flooding, utilizing the Visible Infrared Imaging Radiometer Suite (VIIRS) Flood Detection Map product via the RealEarth data portal. This product is at a spatial resolution of 375 – m spatial resolution and the product’s algorithm calculates the floodwater fraction percentage of a pixel (i.e. how much of a pixel is flooded, expressed in percent).
The example below shows southern Michigan and all the nearby cities (bottom-left) and the VIIRS Flood Detection product (bottom-right), highlighting the areas of floodwater (yellow, orange, and red colors) in the center of the image, and around the state. The images were taken at 2055 UTC, on 22 February 2018. The product also discriminates between different scene types, such as: ice, open water, land, clouds, cloud shadows, mixed ice and water, and snow. Notice the vast areas of cloud cover (grey), cloud shadows (dark grey) to the west and the mixed ice and water (purple) and open water (blue) over Lake Huron.


There is more rain and snow expected in the forecast this weekend for Michigan, potentially leading to more flooding.
Posted in: Miscellaneous, | Comments closed
Vortices off the California coast on 5 February 2018
February 5th, 2018 by Dan BikosGOES-16 captured some amazing imagery on the development of multiple vortices off the coast of southern California on 5 February 2018:
Posted in: Miscellaneous, | Comments closed