SRSOR on 21 May 2014
This blog entry is available in 2 formats:
1) Youtube video (25 minutes): http://youtu.be/H6jMoT3sGiw
2) Web format (below):
GOES Super Rapid Scan Operations for Research (SRSOR) 1-minute imagery was available for the severe weather event of 21 May 2014 that affected Colorado and Wyoming:
http://www.spc.noaa.gov/climo/reports/140521_rpts.html
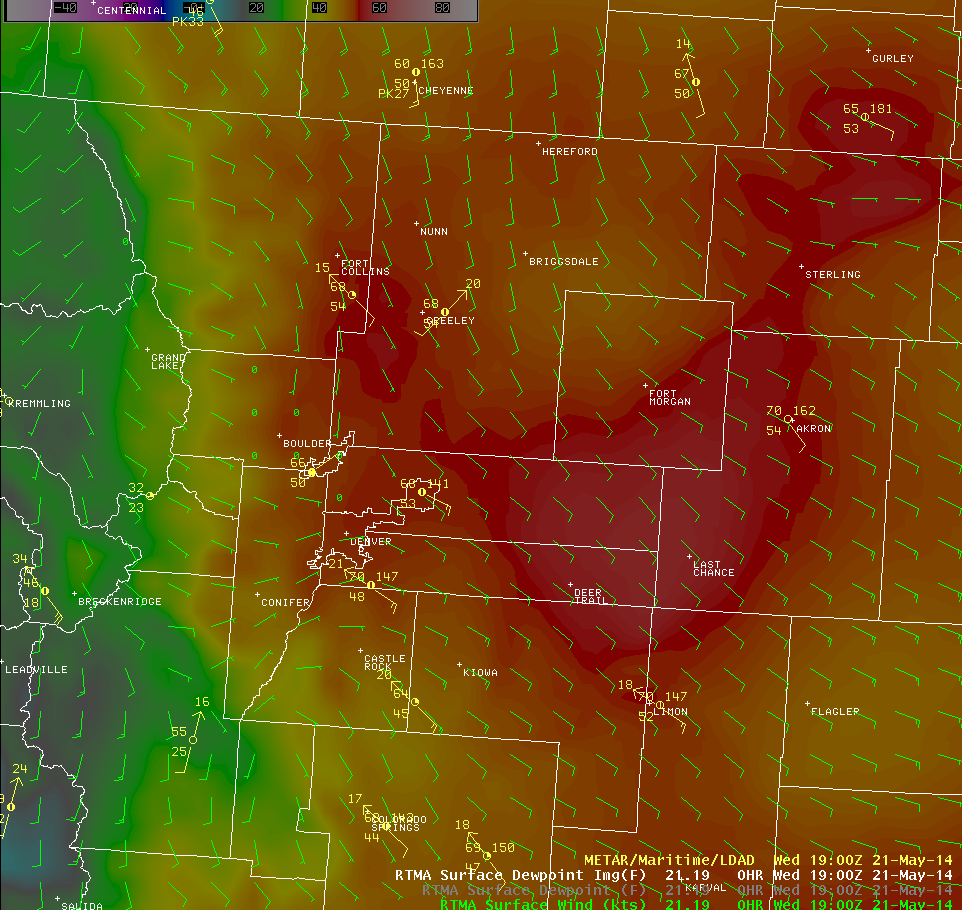
At the surface, southeast winds advected moisture into the Denver area. The following is the 1900 UTC RTMA surface dewpoint and wind:
Surface dewpoints were in the low 50s in the Denver area, meanwhile west of the moist axis in the mountains a much drier air mass was in place. Southwest winds there setup a zone of convergence west of Denver. Convective initiation occurs along this boundary southwest of Denver:
Zoom in using Ctrl +, zoom out using Ctrl – and reset to default zoom with Ctrl 0
You may increase the speed of the loop with the animation speed slider.
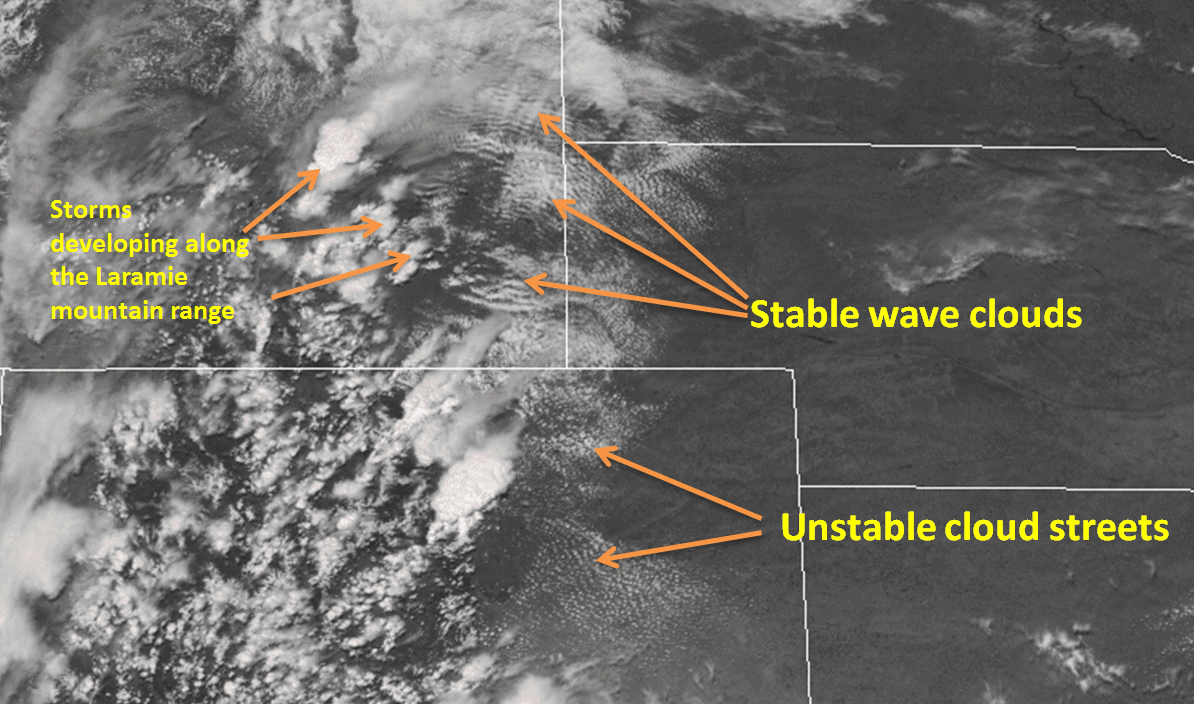
Analyze the low-level clouds across the eastern Plains of Colorado and southeast Wyoming. What are some of the differences? The low-level clouds along and east of Denver are characterized by unstable cloud streets, parallel to the low level flow. The low-level clouds in southeast Wyoming (with the exception of extreme southeast WY) are characterized by stable wave clouds, perpendicular to the winds at inversion top level. West of the wave clouds, convection is developing over the Laramie range where convective temperatures are much lower at higher elevations.
Turning our attention back to Colorado, the next loop of visible SRSOR imagery,
depicts continued growth of the storm southwest of Denver, along with other smaller storms in the vicinity. We observe low-level cloud streets quickly moving toward the primary storm; we therefore expect this storm to continue to grow in the near future. Updrafts that try to develop south of the primary storm move toward the clear region with a lack of cloud streets. This clear region is not as unstable so we would not expect additional thunderstorm activity in the clear area south of the storm in the near future.
The GOES SRSOR visible imagery for the next time period,
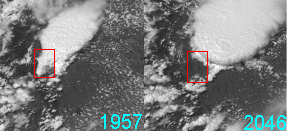
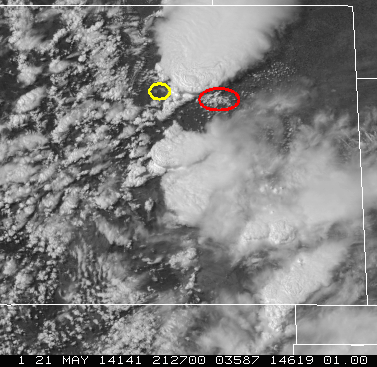
shows that the storm near Denver has gone through intensification with a crisp / distinct edged anvil on the upshear (southwest) side of the storm. The line of clouds extending southwest of the Denver storm is the flanking line. The initial tornado report was at 2005 UTC – see the SPC storm report link above for the additional reports. Observe the rapid clearing (denoted by the red box in the image below) that took place west of the flanking line between 1957 and 2046 UTC:
At 1957 the primary storm was not as intense, and there were other small storms nearby. By 2046 the primary storm was much more intense, and compensating subsidence in the vicinity of the stronger updraft clears out the region where most of the subsidence is occurring (on the southwest flank of the storm). Also, there is a transition from numerous smaller storms to a dominant storm as seen in the WSR-88D KFTG 0.5 degree tilt reflectivity between 2028 – 2156 UTC:
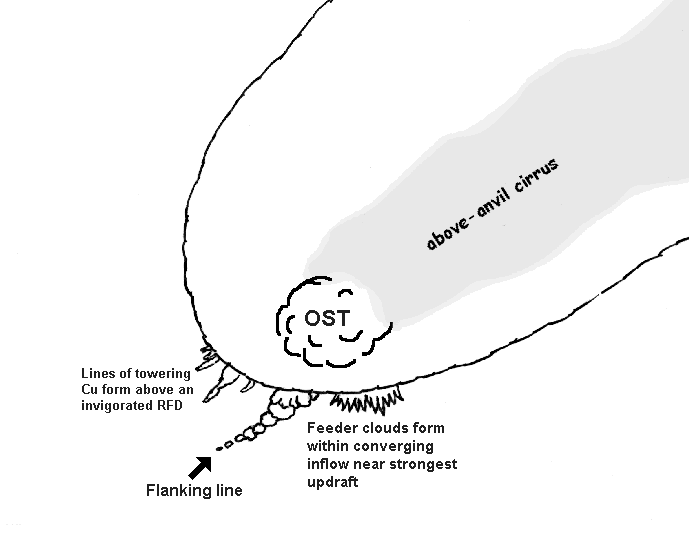
Early in the loop (2035 – 2130 UTC), west of the flanking line, an invigorated field of cumulus develops above the Rear Flank Downdraft (RFD). This satellite signature has been observed with mature severe storms, but the mechanism for their development is a topic open for research. Here is a schematic that depicts the satellite signatures observed on this storm:
Meanwhile, east of the flanking line in the region indicated by the red oval on this graphic
we observe inflow feeder clouds. These inflow feeder clouds are a good indication of a severe storm. For more information on this feature see:
Mazur, Rebecca J., John F. Weaver, Thomas H. Vonder Haar, 2009: A Preliminary Statistical Study of Correlations between Inflow Feeder Clouds, Supercell or Multicell Thunderstorms, and Severe Weather. Wea. Forecasting, 24, 921–934.
Note the region circled in yellow on the graphic above. You will need to zoom in to the looping SRSOR visible imagery to see this. Note that this feature is not there before the storm – it only appears in the wake of the storm. Also, this feature does not move. This is a hail swath caused by the storm which produced a significant depth of hail over a large enough area to be seen in the visible channel due to its higher reflectance of sunlight:
http://images.scribblelive.com/2014/5/21/2b632f39-3bf0-4594-b5ee-4e3b7349f205_500.jpg
The SRSOR visible imagery for the next time period,
shows the continued evolution of the storm of interest, with indications of storm top divergence (and likely rotation as well), along with an enhanced-V/warm wake at storm top.
How does this compare with the satellite imagery that would’ve been available in real -time on AWIPS in “normal” Rapid Scan Operations (RSO) mode?
Keep in mind that the long gap at 2100 UTC is due to a full disk scan.
What can you see in the SRSOR imagery that you cannot see in the RSO imagery?
If you had only seen the RSO imagery, what features do you think you might have missed completely (e.g., the hail swath on the ground in the wake of the storm)?
When GOES-R becomes available, depending on the scan mode chosen, it is possible that 1-minute (and even 30-second) imagery will be available so this type of analysis may be routine when analyzing severe thunderstorm events.
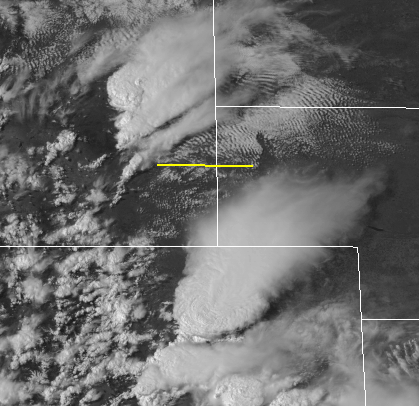
Shifting our attention to southeast Wyoming, notice that much of this area has transitioned from stable wave clouds to unstable cloud streets by this time. It appears that daytime heating has destabilized this area; however, you can still see stable wave clouds further north, and a boundary exists between these two air masses as depicted here:
What role might this boundary have for potential future convection?
By the end of the loop we observe convective initiation at the western end of this boundary, where it intersects the Laramie range. The storm either initiated on the boundary or over the high terrain, or some combination of both. But the key is if storm motion can stay along the boundary, then the storm will likely intensify. Meanwhile, further east along the boundary, there is a growing field of cumulus that should be monitored for potential convective initiation in the near future.
The SRSOR visible imagery for the next time period,
shows the storm over the mountains to be pulsing, going through cycles of slow growth, but not intensifying rapidly. Further east, along the boundary, it appears that multiple small storms are developing and by the end of the loop merge into a dominant updraft.
Here is the SRSOR visible imagery for the next time period:
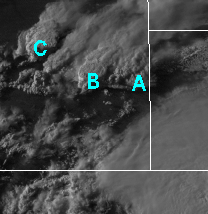
We label the storms of interest:
Storm A weakens rapidly. Why? Storm motion is toward the northeast and it does not stay along the convergence boundary but instead moves toward the region where stable wave clouds existed for an extended period.
Storm B (the one we had been monitoring over the mountains) appears to intensify considerably while storm motion has slowed down quite a bit. The storm is likely along the boundary of interest, and just as importantly, does not have a movement to the northeast where it would meet a quick demise like storm A. Also, there is a possibility that storm A left an outflow boundary for storm B to intersect. Although it’s not discernible here, we will analyze the radar data later. Storm B continues to cycle with updrafts while we see new updrafts grow rapidly. This tornado was observed at 0115 UTC:
https://www.facebook.com/photo.php?fbid=707790585952357&set=o.211703005523464&type=1&theater
The 0.5 degree tilt reflectivity from the WSR-88D in Cheyenne, WY between 2333 – 0127 UTC:
shows that storm B was initially moving northeast, then slowed down considerably (likely along the boundary) and one or two of the earlier updrafts associated with storm A merged with storm B.
The storm furthest to the northwest (Storm C) is also of interest since it shows signs of intensification (overshooting top, storm top divergence, well defined anvil edge on the upshear side) as it is over the high terrain. The storm can be seen on the radar loop as well as it approaches Douglas, WY. This storm is of interest because it is quite far from the radar, so the 0.5 degree tilt reflectivity is looking pretty far up into the storm.
To see other exciting imagery that will be available with GOES-R see:

