User Access to JPSS Data and Imagery Online
May 26th, 2023 by Jorel TorresThe Joint Polar Satellite System (JPSS) constellation currently consists of three satellites that provide environmental monitoring around the globe and datasets to users. The three satellites are the Suomi-National Polar-orbiting Partnership (S-NPP), the National Oceanic and Atmospheric Administration – 20 (NOAA-20) and NOAA-21 (i.e., formerly known as JPSS-2). There are two more satellites that are a part of the JPSS constellation, JPSS-3 and JPSS-4, and are planned to launch within the next decade.

With respect to S-NPP, NOAA-20 and NOAA-21, where can users access the data? Users can access the data and imagery online via a variety of online resources. Note, National Weather Service (NWS) users can also access the data in the Advanced Weather Interactive Processing System – II (AWIPS-II), a forecasting and analysis software package. For simplicity, this blog entry focuses on how users can access JPSS data online.
Here at the Cooperative Institute for Research in the Atmosphere (CIRA), we developed a ‘JPSS Imagery for Users’ webpage (shown below). The webpage is a repository of near-real-time imagery and datasets and provides users information about the JPSS satellite program. It is important to note, the online data resources come from a variety of NOAA or NASA related organizations and cooperative institutes, including CIRA. The webpage is routinely updated with the latest JPSS near-real-time weblinks and information for users to access. Users can access the webpage by clicking on the image below or via this link.
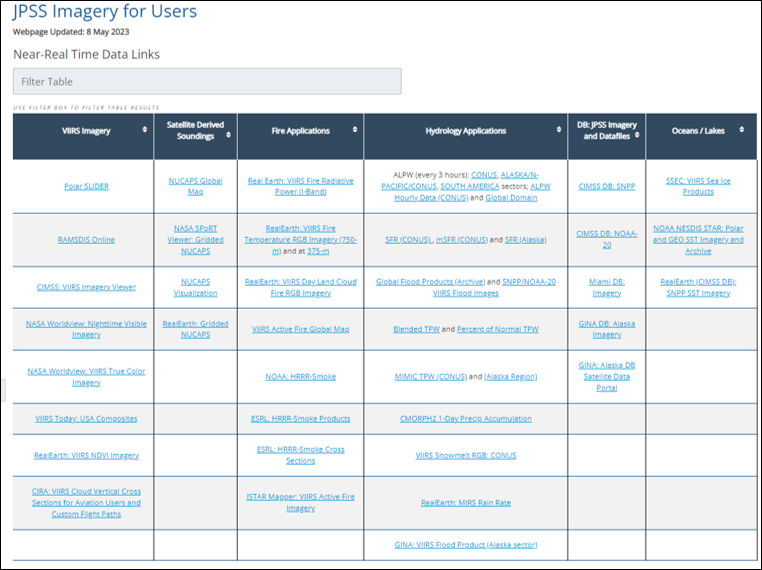
The webpage is categorized in a few topic areas: Visible Infrared Imaging Radiometer Suite (VIIRS) Imagery, Satellite Derived Soundings, Fire Applications, Hydrology Applications, Direct Broadcast (DB) data, and Oceans/Lakes. Users can scroll down toward the bottom of the webpage and encounter a list of JPSS-related acronyms that help users become familiar with the satellite jargon. Additionally, users can access the satellite orbit tracks from SNPP, NOAA-20 and NOAA-21. The orbit tracks assist users in knowing when to expect the data over a specified domain.
Below is an example of JPSS imagery that is accessible online via CIRA Polar SLIDER: sea ice observations over the Chukchi Sea, northwest of Alaska. An animation of the sea ice motion can be seen here.

Posted in: Data Access, News of Interest, POES, Satellites, | Comments closed
March 2, 2023 Severe Weather Event – summary of satellite moisture products
March 3rd, 2023 by Dan Bikos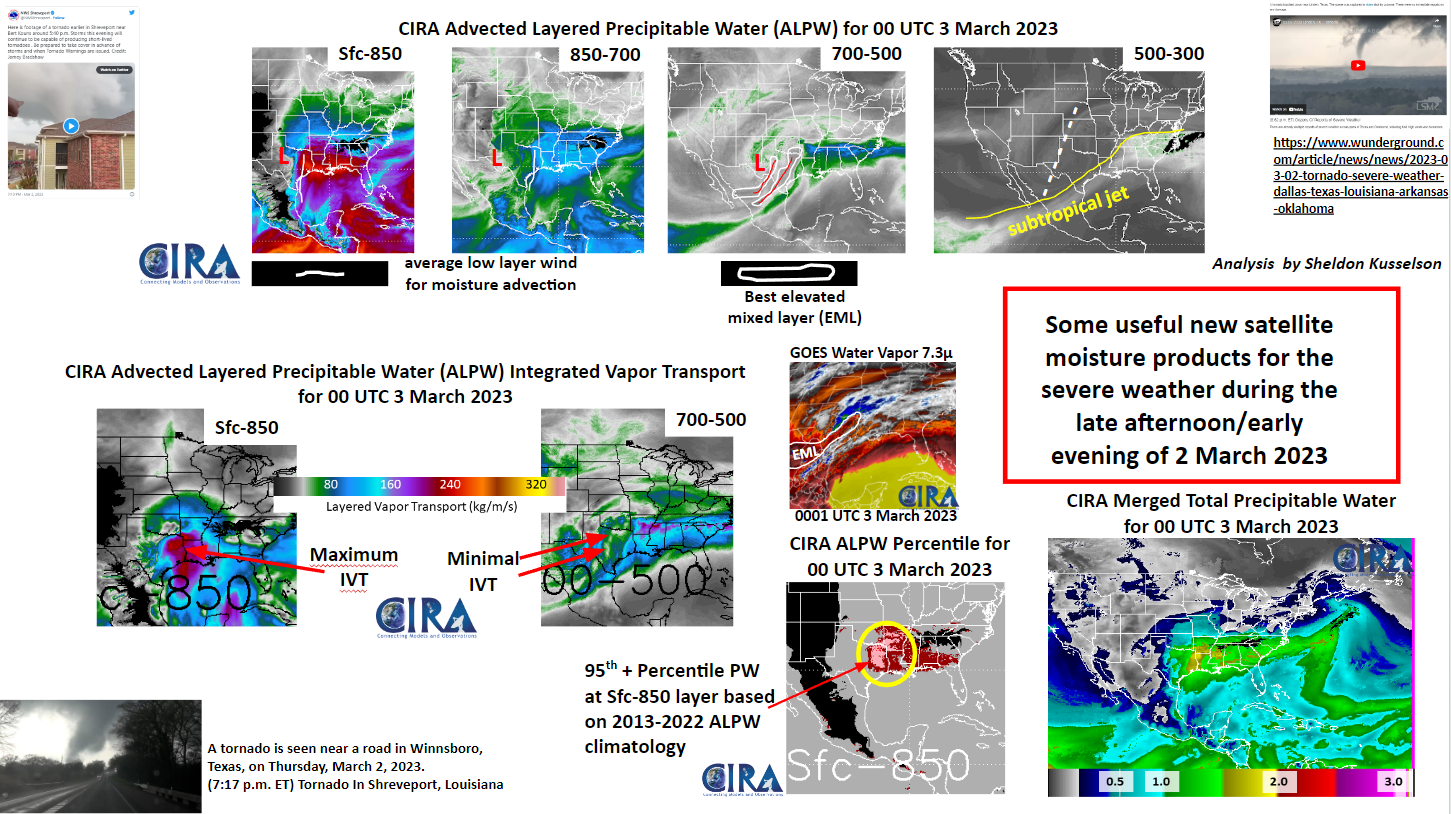
Product Links:
ALPW
Posted in: GOES R, POES, Severe Weather, | Comments closed
Atmospheric River event of 7-10 January, 2023
January 13th, 2023 by Dan BikosBy Sheldon Kusselson and Dan Bikos
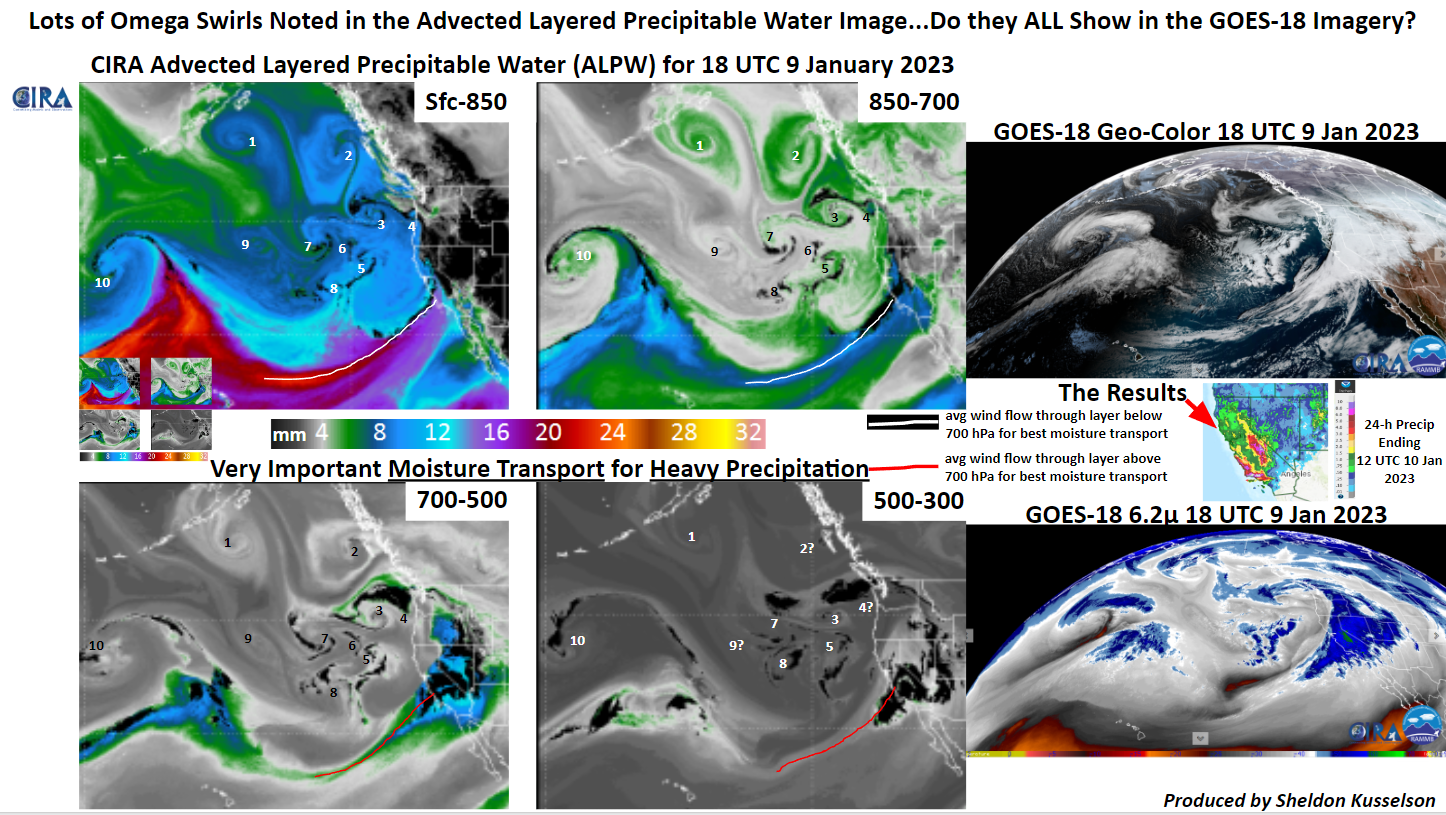
Advected Layer Precipitable Water (ALPW) Loop
Posted in: Heavy Rain and Flooding Issues, Hydrology, | Comments closed
CIRA ALPW depiction of Atmospheric River of 4-5 November 2022
November 9th, 2022 by Dan BikosBy Sheldon Kusselson and Dan Bikos

Advected Layer Precipitable Water (ALPW) loop
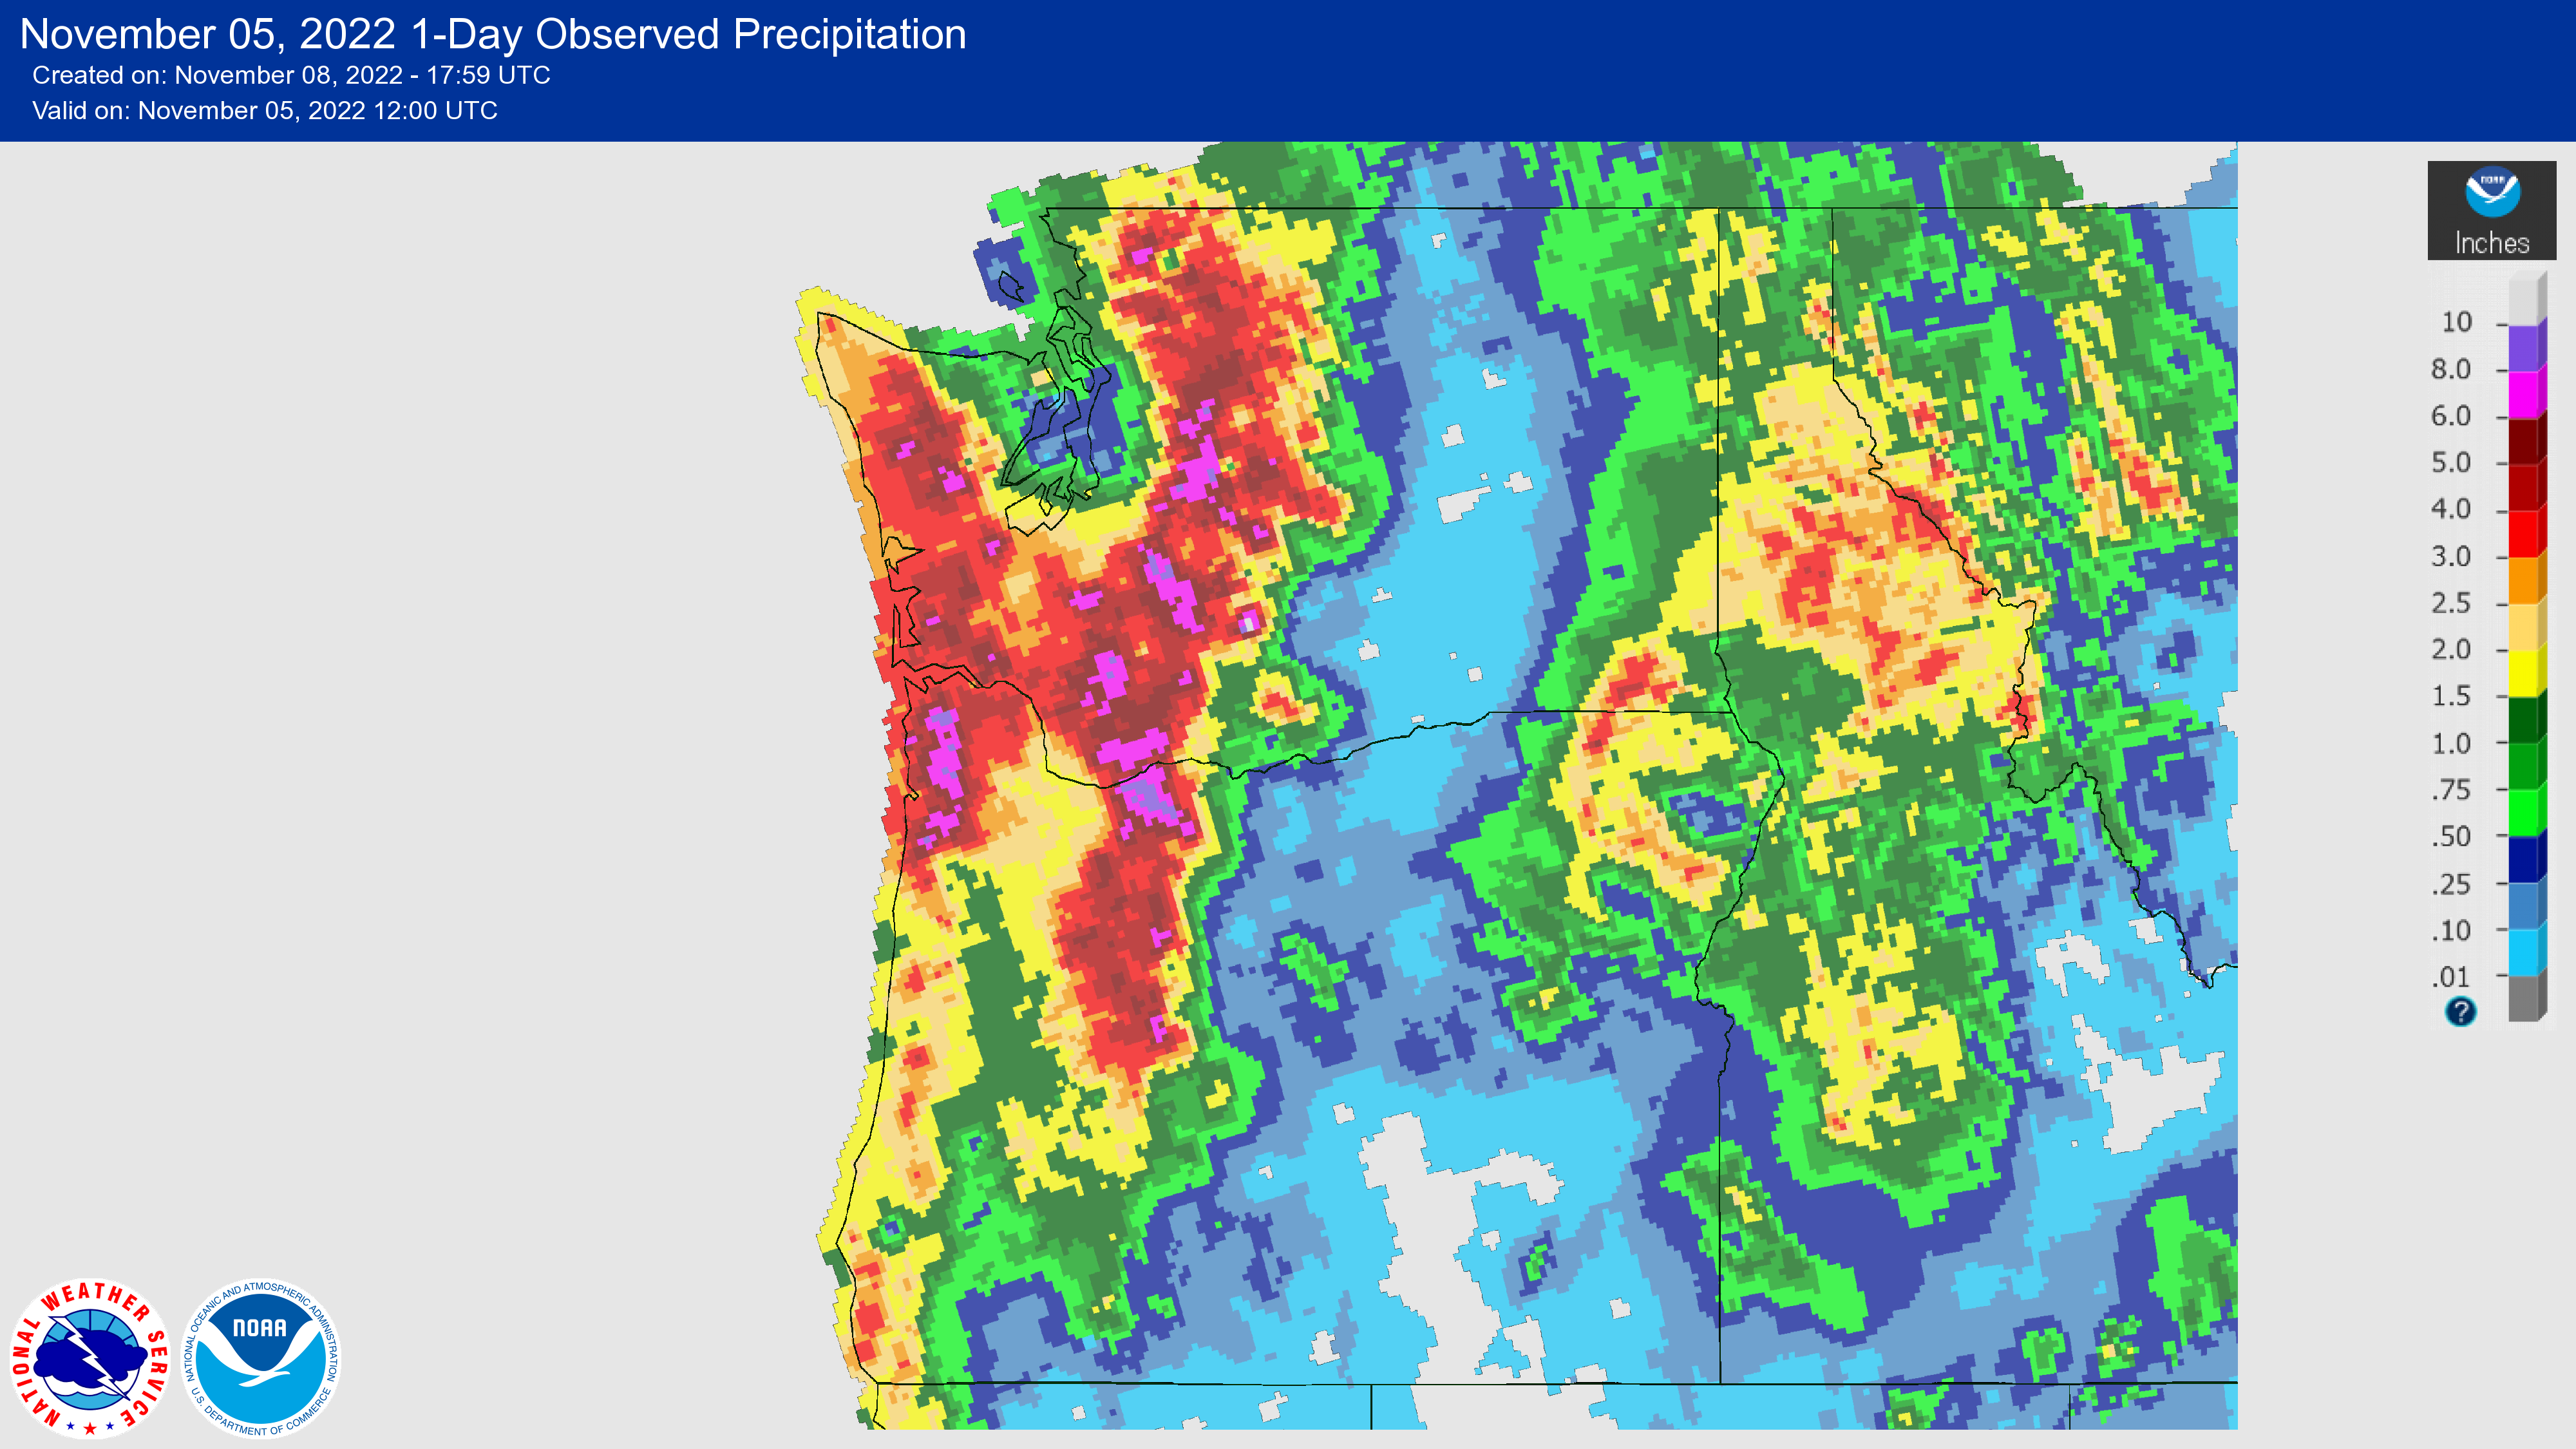
Observed 1-Day Precipitation valid 1200 UTC 5 November 2022 over the Pacific Northwest region:
Posted in: Heavy Rain and Flooding Issues, POES, | Comments closed
Extra-tropical transition of Tropical Cyclone Fiona
September 27th, 2022 by Dan BikosBy Dan Bikos and Sheldon Kusselson
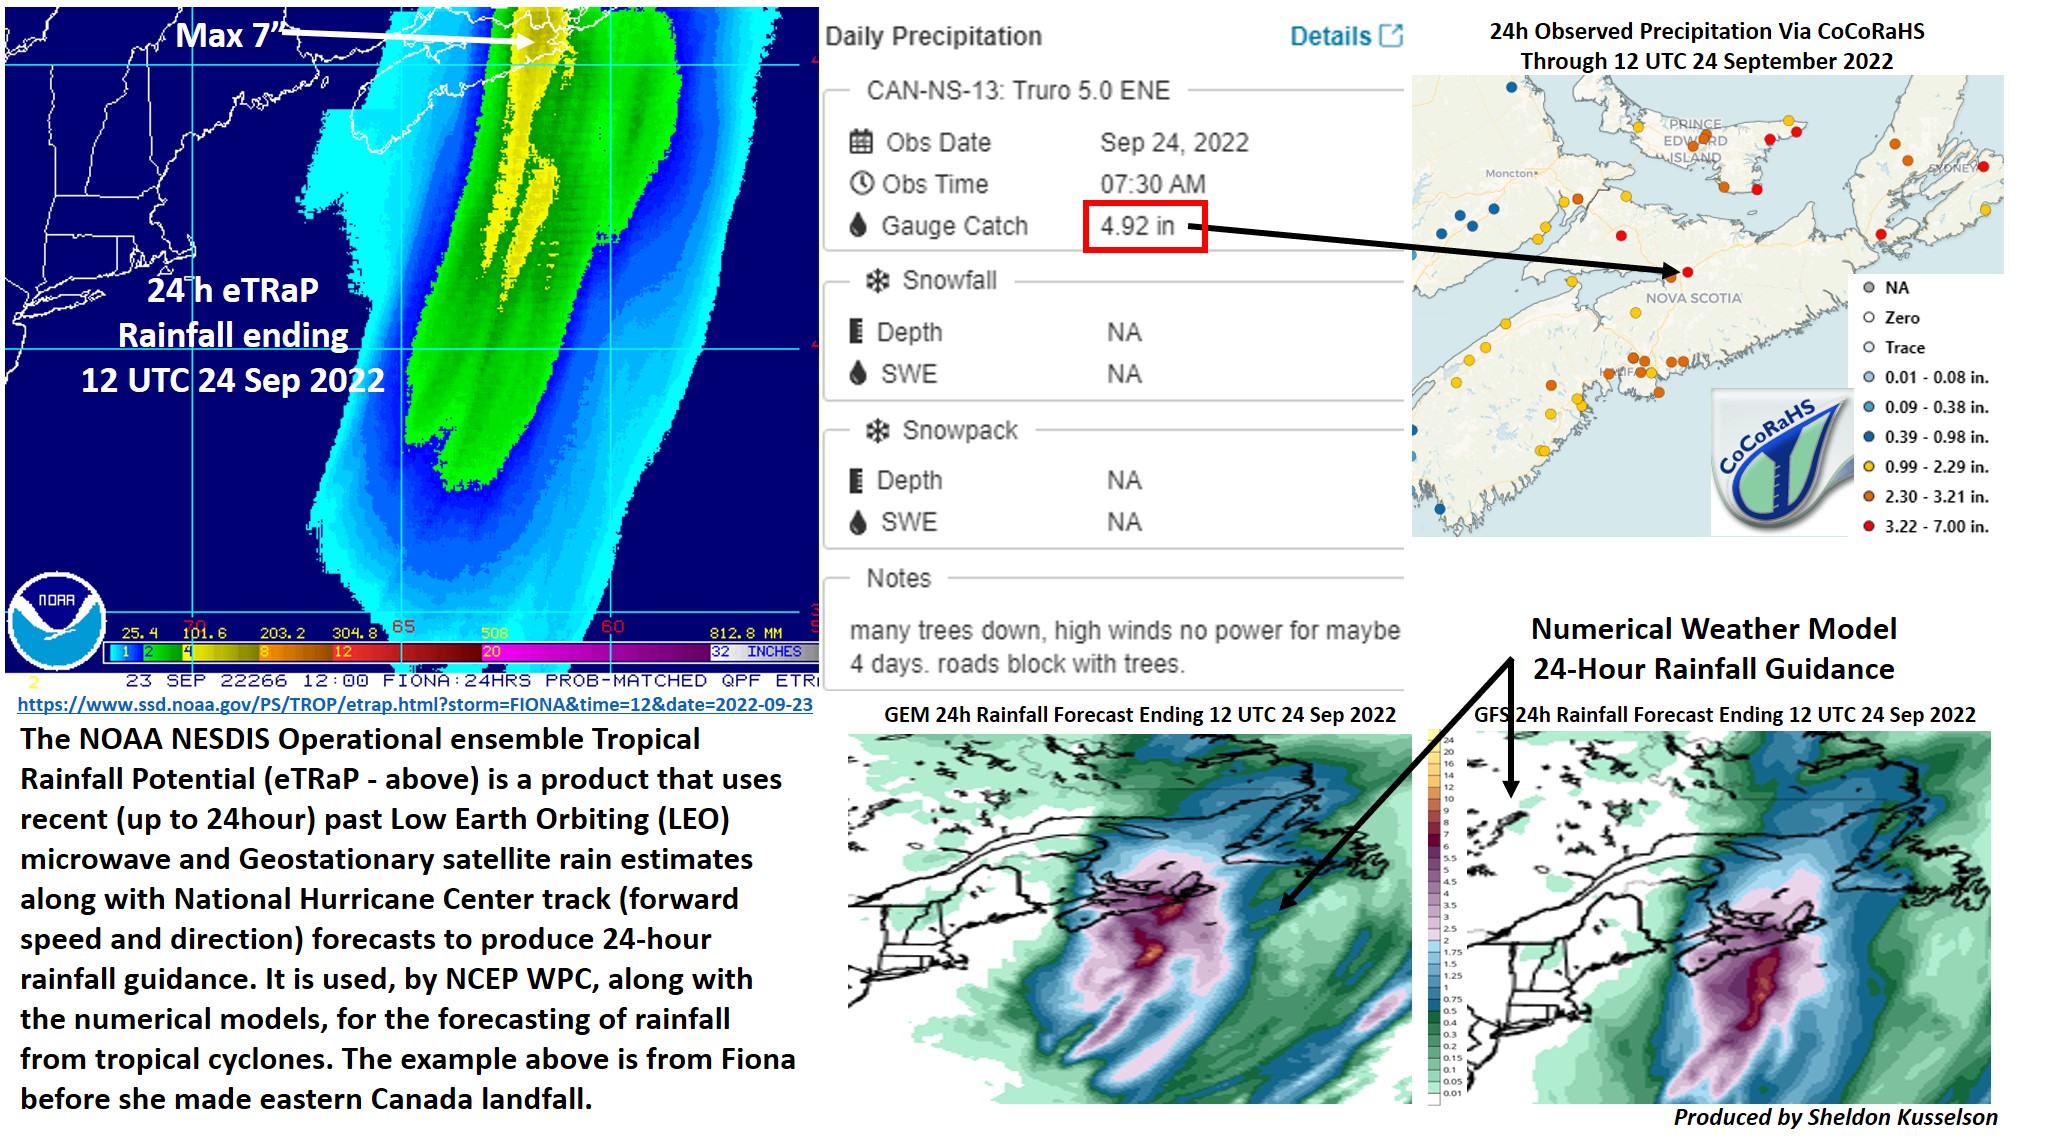
Hurricane Fiona underwent a transition from a tropical cyclone to an extra-tropical cyclone on 23-24 September 2022. The resulting extra-tropical cyclone was very intense and led to significant storm surge, wind damage and heavy rain in southeast Canada centered on Nova Scotia.
The Advected Layer Precipitable Water loop does an excellent job of capturing the transition to an extra-tropical cyclone. The lower left panel displays the precipitable water in the 700-500 mb layer. Note the dry air mass that is initially southwest of the surface low, wrap cyclonically around the low. This dry air intrusion at mid-levels is characteristic of extra-tropical cyclogenesis as the dry conveyor belt (also called dry slot) develops and intensifies. The ALPW loop also shows the abundant low-level moisture transported northward ahead of the surface low towards Nova Scotia, contributing to the heavy rain event.
For another perspective of the extra-tropical cyclogenesis event, we turn to the 3 water vapor bands along with the air mass RGB product. The warmer brightness temperatures observed in the water vapor bands are initially southwest of the surface low and wrap cyclonically around the low. This is coincident with the dry air intrusion with the dry air in the ALPW 700-500 mb layer since this is a subsidence signature.
One of the features we see in the water vapor imagery are these multiple lines indicated by the yellow oval shown below:
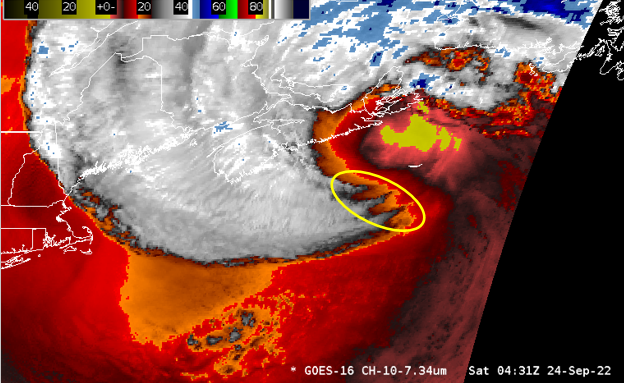
This is a sting jet at low-levels and is commonly observed with very strong winds at the surface.
Additional information on sting jets
Posted in: Cyclogenesis, GOES R, Heavy Rain and Flooding Issues, Hydrology, POES, Satellites, Tropical Cyclones, | Comments closed
