
Sun Glint During the Southern Hemisphere’s Summer Solstice
December 22nd, 2023 by Erin SandersBy Erin Sanders and Bernie Connell
This year the second solstice occurred on December 21, 2023. In Earth’s Northern Hemisphere this marks the start of astronomical winter and is the shortest day of the year in terms of possible daylight. In the Southern Hemisphere the opposite is true and is where we will turn our attention.
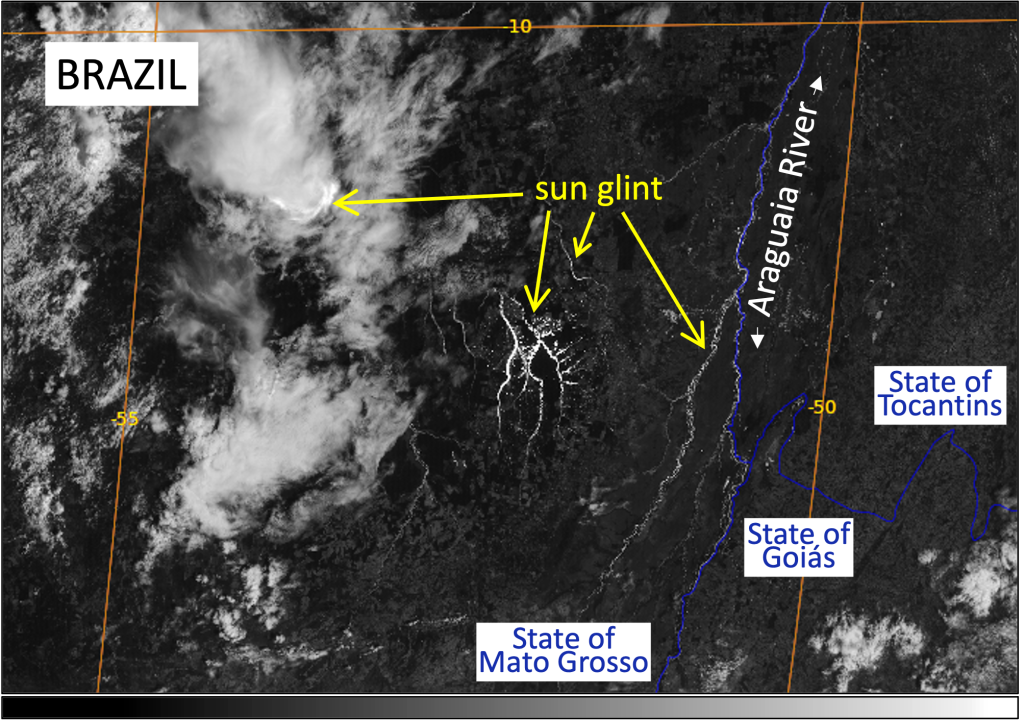
The Amazon basin in South America is the drainage basin of the Amazon River. It’s an extensive region with a river system that transports more water than anywhere else in the world. While we can explore the region with various satellite imagery and products at any time, there is one particularly interesting way to view it. Let me explain. Sun glint is an optical phenomenon that can be seen in visible and near-IR satellite imagery when sunlight is reflected off water surfaces towards the satellite sensor. It occurs with the right positioning between the Sun, Earth, and satellite viewing angle. While we typically notice sun glint over open ocean where it is the most obvious, it is not unusual to spot it over the continents if you know where to look. The following animation shows a small portion of the Amazon basin in Brazil, using recent GOES-16 0.64 µm visible imagery.
GOES-16 0.64 µm visible imagery over Brazil on December 18, 2023 from 12:00-14:30 UTC.
Here it is again for the same time period, but with GOES-16 3.9 µm imagery.
GOES-16 3.9 µm imagery over Brazil on December 18, 2023 from 12:00-14:30 UTC.
As the Sun moves overhead, sun glint appears east to west across the imagery highlighting the expansive water network of the Amazon basin, from major rivers to smaller bodies of water. As the rivers change course and diverge throughout the landscape they create stunning patterns similar to that of a lightning strike. It is most apparent in satellite imagery with the help of reflected solar radiation, and can be fun to spot in this region of South America when the Sun is south of the equator this time of year.
There is another interesting feature related to sun glint that is occasionally seen and could be seen in the previous animations. Did you notice anything unusual? An arc of sun glint appears along a cloud edge around 13:20 UTC. These clouds are likely composed of ice crystals, and with the right viewing geometry creates a higher reflection of sunlight.
 GOES-16 0.64 µm visible imagery over Brazil on December 18, 2023 at 13:20 UTC.
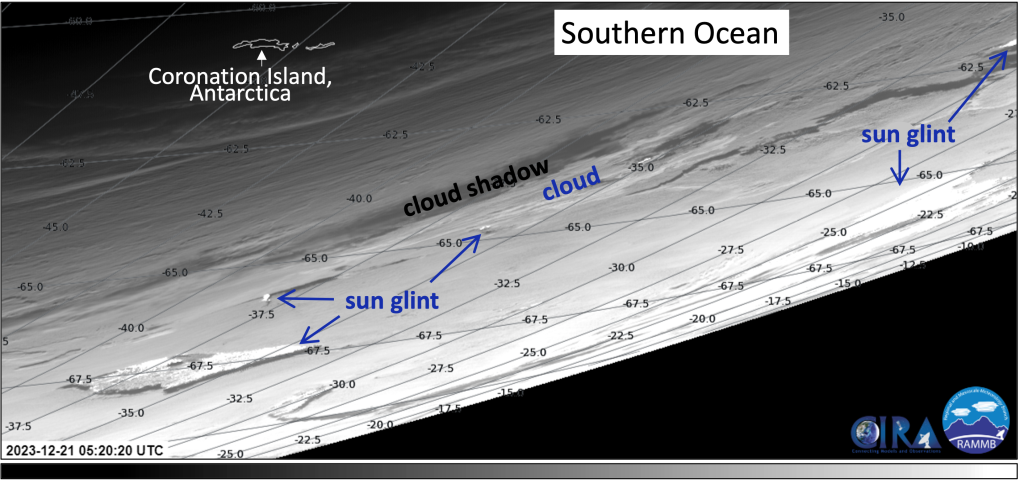
Let’s take a look at another example. Sun glint can be spotted year-round in satellite imagery, typically in the tropics. On the Southern Hemisphere’s summer solstice, the Sun is aligned with the Tropic of Capricorn at roughly 23.4° south latitude. This is the southernmost latitude where the Sun can be directly overhead, and we find sun glint extending the farthest south at this time of year. The following animation shows sun glint as far south as 67.5° south latitude over the Southern Ocean.
GOES-16 0.64 µm imagery over the Southern Ocean on December 21, 2023 from 04:00-06:20 UTC.
Were you able to find it? Although there is widespread cloud cover, there are clearings where open ocean and Antarctic sea ice peek through in the 0.64 µm satellite imagery. In these places we are able to see sun glint, as the area goes from dark to very bright to dark again in a short amount of time.
GOES-16 0.64 µm visible imagery over the Southern Ocean on December 21, 2023 at 05:20 UTC.
Posted in: Miscellaneous, | Comments closed
An Atmospheric River impacts the PNW
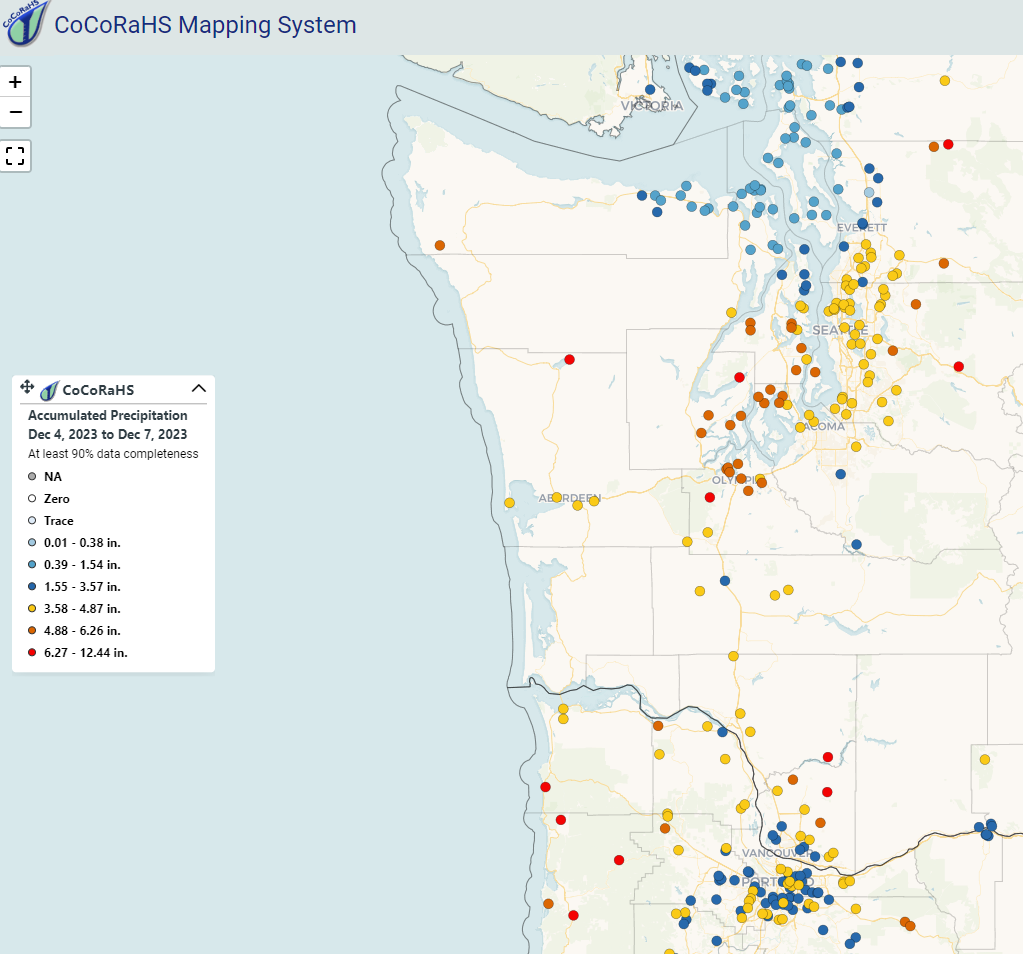
December 8th, 2023 by Jorel TorresAnother atmospheric river event impacted the Pacific Northwest (PNW), earlier this week. Plumes of moisture moved into the region that led to heavy precipitation and flooding for the states of Washington, Oregon, and Idaho. 24-hour precipitation totals from Monday, 4 December through Tuesday, 5 December 2023 were quite impressive over western Washington. Additionally, the Seattle-Tacoma (Sea-Tac) and Olympia Airports broke their respective precipitation records for daily rainfall. Accumulated precipitation totals (via CoCoRaHS) from 4-7 December 2023 are seen below over western Washington and northwestern Oregon.
Polar orbiting satellites observed the atmospheric river, located along the southeast side of a low pressure system that made landfall in southeast Alaska. The AWIPS 4-panel below highlights three products: the Blended Total Precipitable Water (TPW), the Blended Percent of Normal TPW, and the Blended Rain Rate. The Blended TPW product shows the total TPW throughout the atmosphere and observes the elongated moisture plume that spans from the tropics northeastward into the PNW. The Percent of Normal TPW is based on the 1988-1999 NASA NVAP climatology and can be employed to observed the significance of the atmospheric moisture in the region. Near-climatological normal TPW values (white colors) and above normal climatological values (aqua and yellow) are observed within the atmospheric river throughout the time period. Observing rain rates over data-sparse regions (e.g., oceans) is key to the utility of the Blended Rain Rate product, where an extensive line of heavy precipitation advects toward and over the PNW.
Blended TPW (top-left), Blended Percent of Normal TPW (top-right), and the Blended Rain Rate (bottom-left) observations from 2Z, 4 December 2023 to 16Z, 5 December 2023.
The Advected Layer Precipitable Water (ALPW) product also observed the atmospheric river. ALPW is a unique product, in which it observes precipitable water values in 4 atmospheric layers: surface to 850 mb, 850 mb to 700 mb, 700 mb to 500 mb, and 500 mb to 300 mb. An ALPW animation (see below) highlights the evolution of the atmospheric river over the course of 3 days; notice high precipitable water values not only in the low levels of the atmosphere, but also in the upper-levels (i.e., 700-500 mb layer). Note, the ALPW units are expressed in inches.
ALPW observations from 20Z, 4 December 2023 to 15Z, 6 December 2023.
Want to access the blended products and the ALPW online?
Users can access the data via the following weblinks: Blended Rain Rate, Blended TPW, Percent of Normal TPW, and ALPW. Additional product links can be accessed via the JPSS Imagery for Users webpage.
Posted in: AWIPS, Data Access, Heavy Rain and Flooding Issues, Hydrology, POES, Satellites, | Comments closed
The Snowfall Rate (SFR) and merged SFR Products
November 30th, 2023 by Jorel TorresAs of early November 2023, the TOWR-S RPM v24 has been released for National Weather Service (NWS) users to update their local AWIPS terminals with the latest satellite data capabilities. Within the RPM v24 release, more NWS CONUS users will be able to access the Snowfall Rate (SFR) and the merged SFR (satellite plus radar) products in AWIPS.
The SFR product observes the liquid-equivalent, instantaneous snowfall rate over a domain. The product is derived from passive microwave instruments that are on-board polar-orbiting satellites. Users can employ the product to identify the snowfall areal extent and locate regions of the most intense snowfall, which may not be as discernible in the visible and infrared imagery. SFR is also quite valuable in data sparse regions (i.e., areas that lack radar coverage, terrain, etc.), where the product fills in these observational gaps. Note, there are some key attributes to keep in mind while using SFR in operations: the product values are expressed in inches per hour, the spatial resolution varies from 7-16 km at the satellite subpoint, and the temporal resolution is coarse in the mid-latitudes (i.e., ~18 overpasses per day that are not evenly distributed). The polar regions receive significantly more overpasses.
As we scan over CONUS this week, we notice snow falling over the Great Lakes region, where lake effect snow bands engulf the area on 28 November 2023. The SFR product observes the snowfall rates over the region and downwind of the lakes. See the animation below. Notice higher snowfall rates that are observed near and east/southeast of Lake Huron, Erie, and Ontario.
SFR observations from 0633Z – 1937Z, 28 November 2023.
An addition to the SFR product, users will also be able to access the merged SFR product, which incorporates both satellite and radar datasets. The mSFR is a liquid equivalent, instantaneous snowfall rate product, however, it is derived from NSSL Multi-Radar Multi-Sensor System (MRMS) precipitation rate (i.e., snowfall only) data and the SFR satellite data. This unique product provides users a higher temporal refresh rate (~available every 10 minutes), where users can observe the snowfall activity within the range of the radar but also in data-sparse regions. Refer to the animation below that highlights the mSFR observations over the Great Lakes. Notice the swaths of SFR data that are seen infrequently during the time period; users can differentiate between the two datasets based on the pixel size (i.e., the radar data exhibits a finer spatial resolution of 1-km).
mSFR observations from 15Z – 1930Z, 28 November 2023.
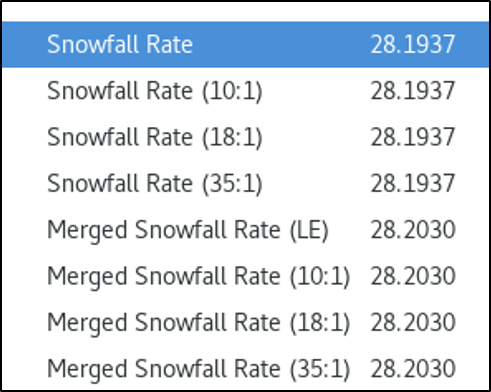
Note, the SFR and mSFR liquid-equivalent (a.k.a., LE, expressed in inches per hour), the 10:1, 18:1, and 35:1 snowfall to liquid ratio products are also available in AWIPS. Refer to the AWIPS menu below that shows the list of available products.
Need to access the SFR and mSFR data online? NOAA/NESDIS/STAR/CISESS provides access to the data over CONUS (SFR and mSFR CONUS). Users can access the SFR data over the Alaska sector as well (SFR Alaska).
Users can check out the latest Satellite Liaison Blog that covers how to observe lake-effect snow events with other types of satellite datasets.
Posted in: AWIPS, Data Access, Hydrology, Lake Effects, Miscellaneous, POES, Satellites, Winter Weather, | Comments closed
NOAA-21 Designated as the Secondary JPSS Satellite
November 14th, 2023 by Jorel TorresPer NOAA Office of Satellite and Product Operations (OSPO), the last requirement was fulfilled to declare NOAA-21 operational and as the secondary satellite of the JPSS constellation. As of 3 November 2023, the three existing JPSS satellites are now designated in the following order: Primary – NOAA-20, Secondary – NOAA-21, and Tertiary – SNPP. This change should not effect the data distribution, however, the 3 JPSS satellites are operated in the new prioritized order. For instance, the primary and secondary satellites (in this case, NOAA-20 and NOAA-21) take priority in data processing and spacecraft maneuvers.
In the incoming months, once the majority of NOAA-21 datasets reach provisional maturity or better, the NOAA-21 satellite will be assigned as the primary satellite. NOAA-20 will then become the secondary satellite, and SNPP, the tertiary satellite. With respect to SNPP, the tertiary designation indicates that any non-nominal issue or ground resource constraint will be addressed under a best-effort basis, unless a satellite or instrument health and safety issue occurs.
The current and future JPSS satellite designations and orbital configurations can be seen in the image below. Refer to the current phase highlighted in the green box, and the last phase located to the right, titled, ‘After Early 2024’. Image credit, thanks to TOWR-S/NOAA.
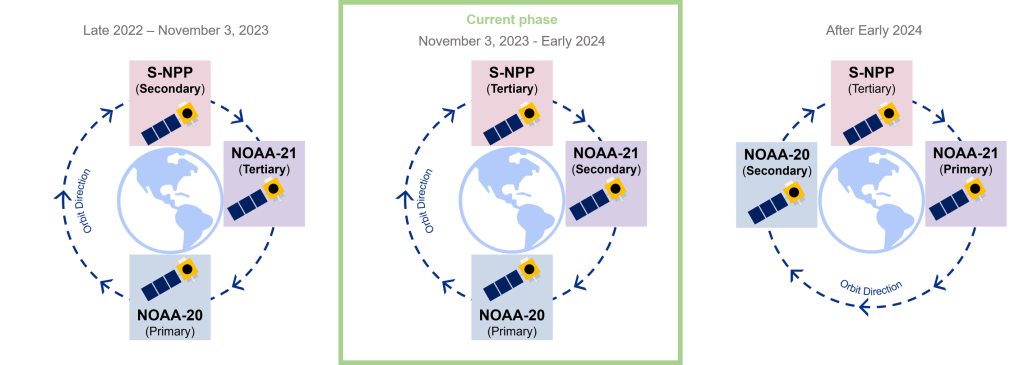
We look forward to NOAA-21 becoming the primary satellite in the JPSS constellation in 2024, along with the updated JPSS orbital configuration. Once NOAA-21 becomes the primary satellite, NOAA-20 and NOAA-21 will be separated by a 1/2 orbit (~50-min apart), with SNPP placed 1/4 orbit between the two.
Sources: NOAA OSPO – N21 Secondary Satellite in Constellation Declaration, NOAA NESDIS – N21 is Operational, and NOAA/NWS/TOWR-S.
Posted in: POES, Satellites, VIIRS, | Comments closed
Bolivia Fires
October 27th, 2023 by Jorel TorresOver the past week, fires were raging in the country of Bolivia. Numerous fires were observed by the GOES-16 geostationary satellite, and were spotted across the country. The largest fires were seen in central Bolivia, specifically located northwest of the city of Santa Cruz. On 22 October 2023, the GOES-16 ABI Day Fire RGB, which is sensitive to fire hotspots, burn scars and fire smoke observed the active fires (red colors) and the corresponding smoke plumes (blue colors) covering central Bolivia. The smoke plumes advected to the southeast and impacted the neighboring towns and cities. Refer to the animation below.
Animation 1: GOES-16 ABI Day Fire RGB observations from 17-1930Z, 22 October 2023.
During the same timeframe, VIIRS daytime overpasses from SNPP and NOAA-20 captured the fires at a high spatial resolution of 375-m. Although the polar-orbiters are not as timely as geostationary satellites (i.e., exhibit a coarser temporal resolution), they can provide the finer details of atmospheric and surface features, such as fire and smoke. The VIIRS version of the Day Fire RGB can be seen below, provided by SNPP and NOAA-20.
Animation 2: SNPP and NOAA-20 VIIRS Day Fire RGB observations at 1730Z and 1821Z, 22 October 2023.
Another RGB that can be employed for the fire monitoring is the Fire Temperature RGB, which provides a qualitative estimate of fire intensity. In the RGB imagery, active fires are depicted from red (i.e., cool, less intense fires) to orange to yellow to white pixels (i.e., most intense fires). The animation below highlights a comparison between the VIIRS Day Fire RGB and the VIIRS Fire Temperature RGB from the 1821Z NOAA-20 overpass. The most intense fires are seen near and south of 16 degrees latitude. Note, that the VIIRS Fire Temperature RGB is at 750-m spatial resolution.
Animation 3: A comparison between the NOAA-20 VIIRS Day Fire RGB and VIIRS Fire Temperature RGB at 1821Z, 22 October 2023.
Note to users: the GOES ABI Day Fire RGB can be accessed via CIRA SLIDER. The VIIRS Day Fire RGB and VIIRS Fire Temperature RGB can be accessed via 3 JPSS sectors on CIRA SLIDER: CONUS, Northern Hemisphere, and the Southern Hemisphere.
Posted in: Data Access, Fire Weather, POES, Satellites, VIIRS, | Comments closed